Inequality: Mostly Among the 1%
The super-rich are outstripping the merely wealthy -- but the rest of us are a lot more equal than you might think.

You are now subscribed
Your newsletter sign-up was successful
Want to add more newsletters?

Delivered daily
Kiplinger Today
Profit and prosper with the best of Kiplinger's advice on investing, taxes, retirement, personal finance and much more delivered daily. Smart money moves start here.

Sent five days a week
Kiplinger A Step Ahead
Get practical help to make better financial decisions in your everyday life, from spending to savings on top deals.

Delivered daily
Kiplinger Closing Bell
Get today's biggest financial and investing headlines delivered to your inbox every day the U.S. stock market is open.

Sent twice a week
Kiplinger Adviser Intel
Financial pros across the country share best practices and fresh tactics to preserve and grow your wealth.

Delivered weekly
Kiplinger Tax Tips
Trim your federal and state tax bills with practical tax-planning and tax-cutting strategies.

Sent twice a week
Kiplinger Retirement Tips
Your twice-a-week guide to planning and enjoying a financially secure and richly rewarding retirement

Sent bimonthly.
Kiplinger Adviser Angle
Insights for advisers, wealth managers and other financial professionals.

Sent twice a week
Kiplinger Investing Weekly
Your twice-a-week roundup of promising stocks, funds, companies and industries you should consider, ones you should avoid, and why.

Sent weekly for six weeks
Kiplinger Invest for Retirement
Your step-by-step six-part series on how to invest for retirement, from devising a successful strategy to exactly which investments to choose.
After a brief pause for the Great Recession, income inequality is rising again, with the highest-earning 1% getting the lion's share of added income and the other 99% dividing the remainder.
But the picture of inequality that this paints is a little misleading. It turns out that there is a lot less inequality among the vast majority of Americans than there might seem, and it's not getting worse.
SEE ALSO: All Our Economic Outlooks
From just $107.88 $24.99 for Kiplinger Personal Finance
Become a smarter, better informed investor. Subscribe from just $107.88 $24.99, plus get up to 4 Special Issues

Sign up for Kiplinger’s Free Newsletters
Profit and prosper with the best of expert advice on investing, taxes, retirement, personal finance and more - straight to your e-mail.
Profit and prosper with the best of expert advice - straight to your e-mail.
The most common measure of inequality is the share of income earned by the top 1% -- the highest-earning 1.5 million individuals and couples. This was about 18% of all income in 2011, twice as much as when Ronald Reagan was reelected president in 1984. Because one-percenters get a large portion of their income from investments, their share of all income fell to 17% after the stock market plunged in 2008.
Since then, the stock market's robust recovery and meager growth in the wages and salaries that the lower 99% rely on has meant that an overwhelming share of total income growth has gone to the wealthiest citizens. In 2010, $9 of every additional $10 earned went to the top 1%, and data due in a few months will show that the same happened in 2011. With stocks up better than 10% already this year and high unemployment holding down wages and salaries, that trend will continue in 2012.
But probe a bit deeper and another picture emerges. The gap between most one-percenters and most of the 99% isn't that wide because the most extreme inequality is at the very top of the income scale. The chasm between the super-rich -- the highest-earning 15,000 tax filers -- and others in the top 1% is so large that it skews the overall result. Factor it out, and even inequality between the poor and the well-off is far less than 10-to-1. Though that's still too much inequality in the view of some people, it's not the extreme inequality that often makes the headlines.
Consider how much inequality there is within the 1% richest. The average yearly income for this group is $418,000. The average income for the top 1% of them -- the 15,000 in "the 0.01%" -- is $23 million, or more than 50 times as much.
Contrast that with the ratio between the $418,000 average income of the 1% and the average for all tax filers -- $68,000 in 2010. Even after accounting for the fact that this $68,000 is inflated a bit by the big earnings at the very top, the average top earner receives less than six times as much income as the average taxpayer. There's much less distance between the average American and the average rich person than there is between the merely rich and the super-rich.
Sliced another way, there is a similar difference between the bottom of the 99% and the top of it. According to one study, when government subsidies and employer-funded health insurance are included, the ratio of well-off taxpayers at the 90th percentile of income and the poor at the 10th percentile is also about 6-to-1. And this measure of inequality isn't getting wider. That 6-to-1 ratio is unchanged since 1990s, and the ratio was roughly 5-to-1 in the 1980s.
By contrast, inequality within the top 1% soared over that same period. In 1984, the super-rich 0.01% earned $1 out of every $9 pulled in by all of the richest 1%. By 2010, the super-rich were hauling in $1 of every $5 earned by one-percenters.
In fact, the concentration of income among the super-rich is about as high as it has ever been, and much higher than it was for most of the 20th century. They collected about 3.3% of all income in 2011, a little below the record 3.5% in 2007 and triple the level in 1984. Between World Wars I and II, the average for the super-rich was 2% of income, and from 1946 to 1991, it was 1% of income. Then it started rising.
Meanwhile, inequality among the vast majority of people isn't so wide, and it isn't getting wider. Even after a brutal recession that lowered living standards for most people, the average American isn't losing ground compared with most others, even if the gulf between average and very wealthy is growing broader. Cornell University economist Robert Frank, an expert on public attitudes about wealth, argues that perceptions about living standards are based as much on one's relative position compared with neighbors and coworkers than on actual dollars and cents.
If, in F. Scott Fitzgerald's words, the very rich "are different from you and me," the super-rich are so different that their wealth prompts more curiosity than outrage. The wealth of Warren Buffett and Mark Zuckerberg is beyond the aspirations or care of most people in today's challenging economy. What's another billion or two?

-
 Dow Adds 1,206 Points to Top 50,000: Stock Market Today
The S&P 500 and Nasdaq also had strong finishes to a volatile week, with beaten-down tech stocks outperforming.
-
 Ask the Tax Editor: Federal Income Tax Deductions
Ask the Editor In this week's Ask the Editor Q&A, Joy Taylor answers questions on federal income tax deductions
-
 States With No-Fault Car Insurance Laws (and How No-Fault Car Insurance Works)
A breakdown of the confusing rules around no-fault car insurance in every state where it exists.


-
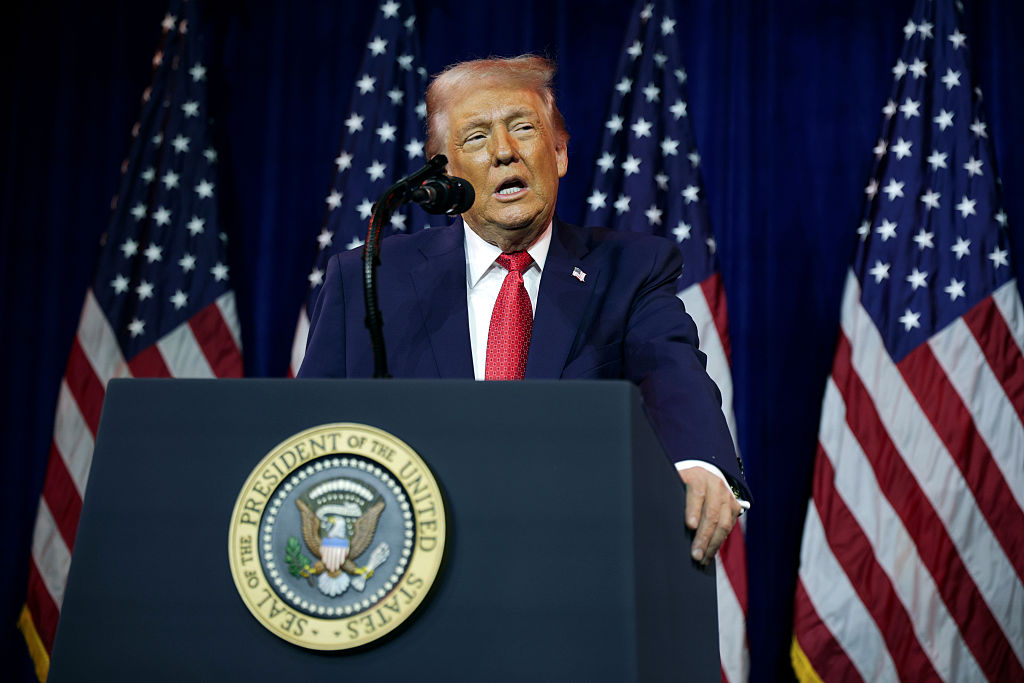 Trump Reshapes Foreign Policy
The Kiplinger Letter The President starts the new year by putting allies and adversaries on notice.
-
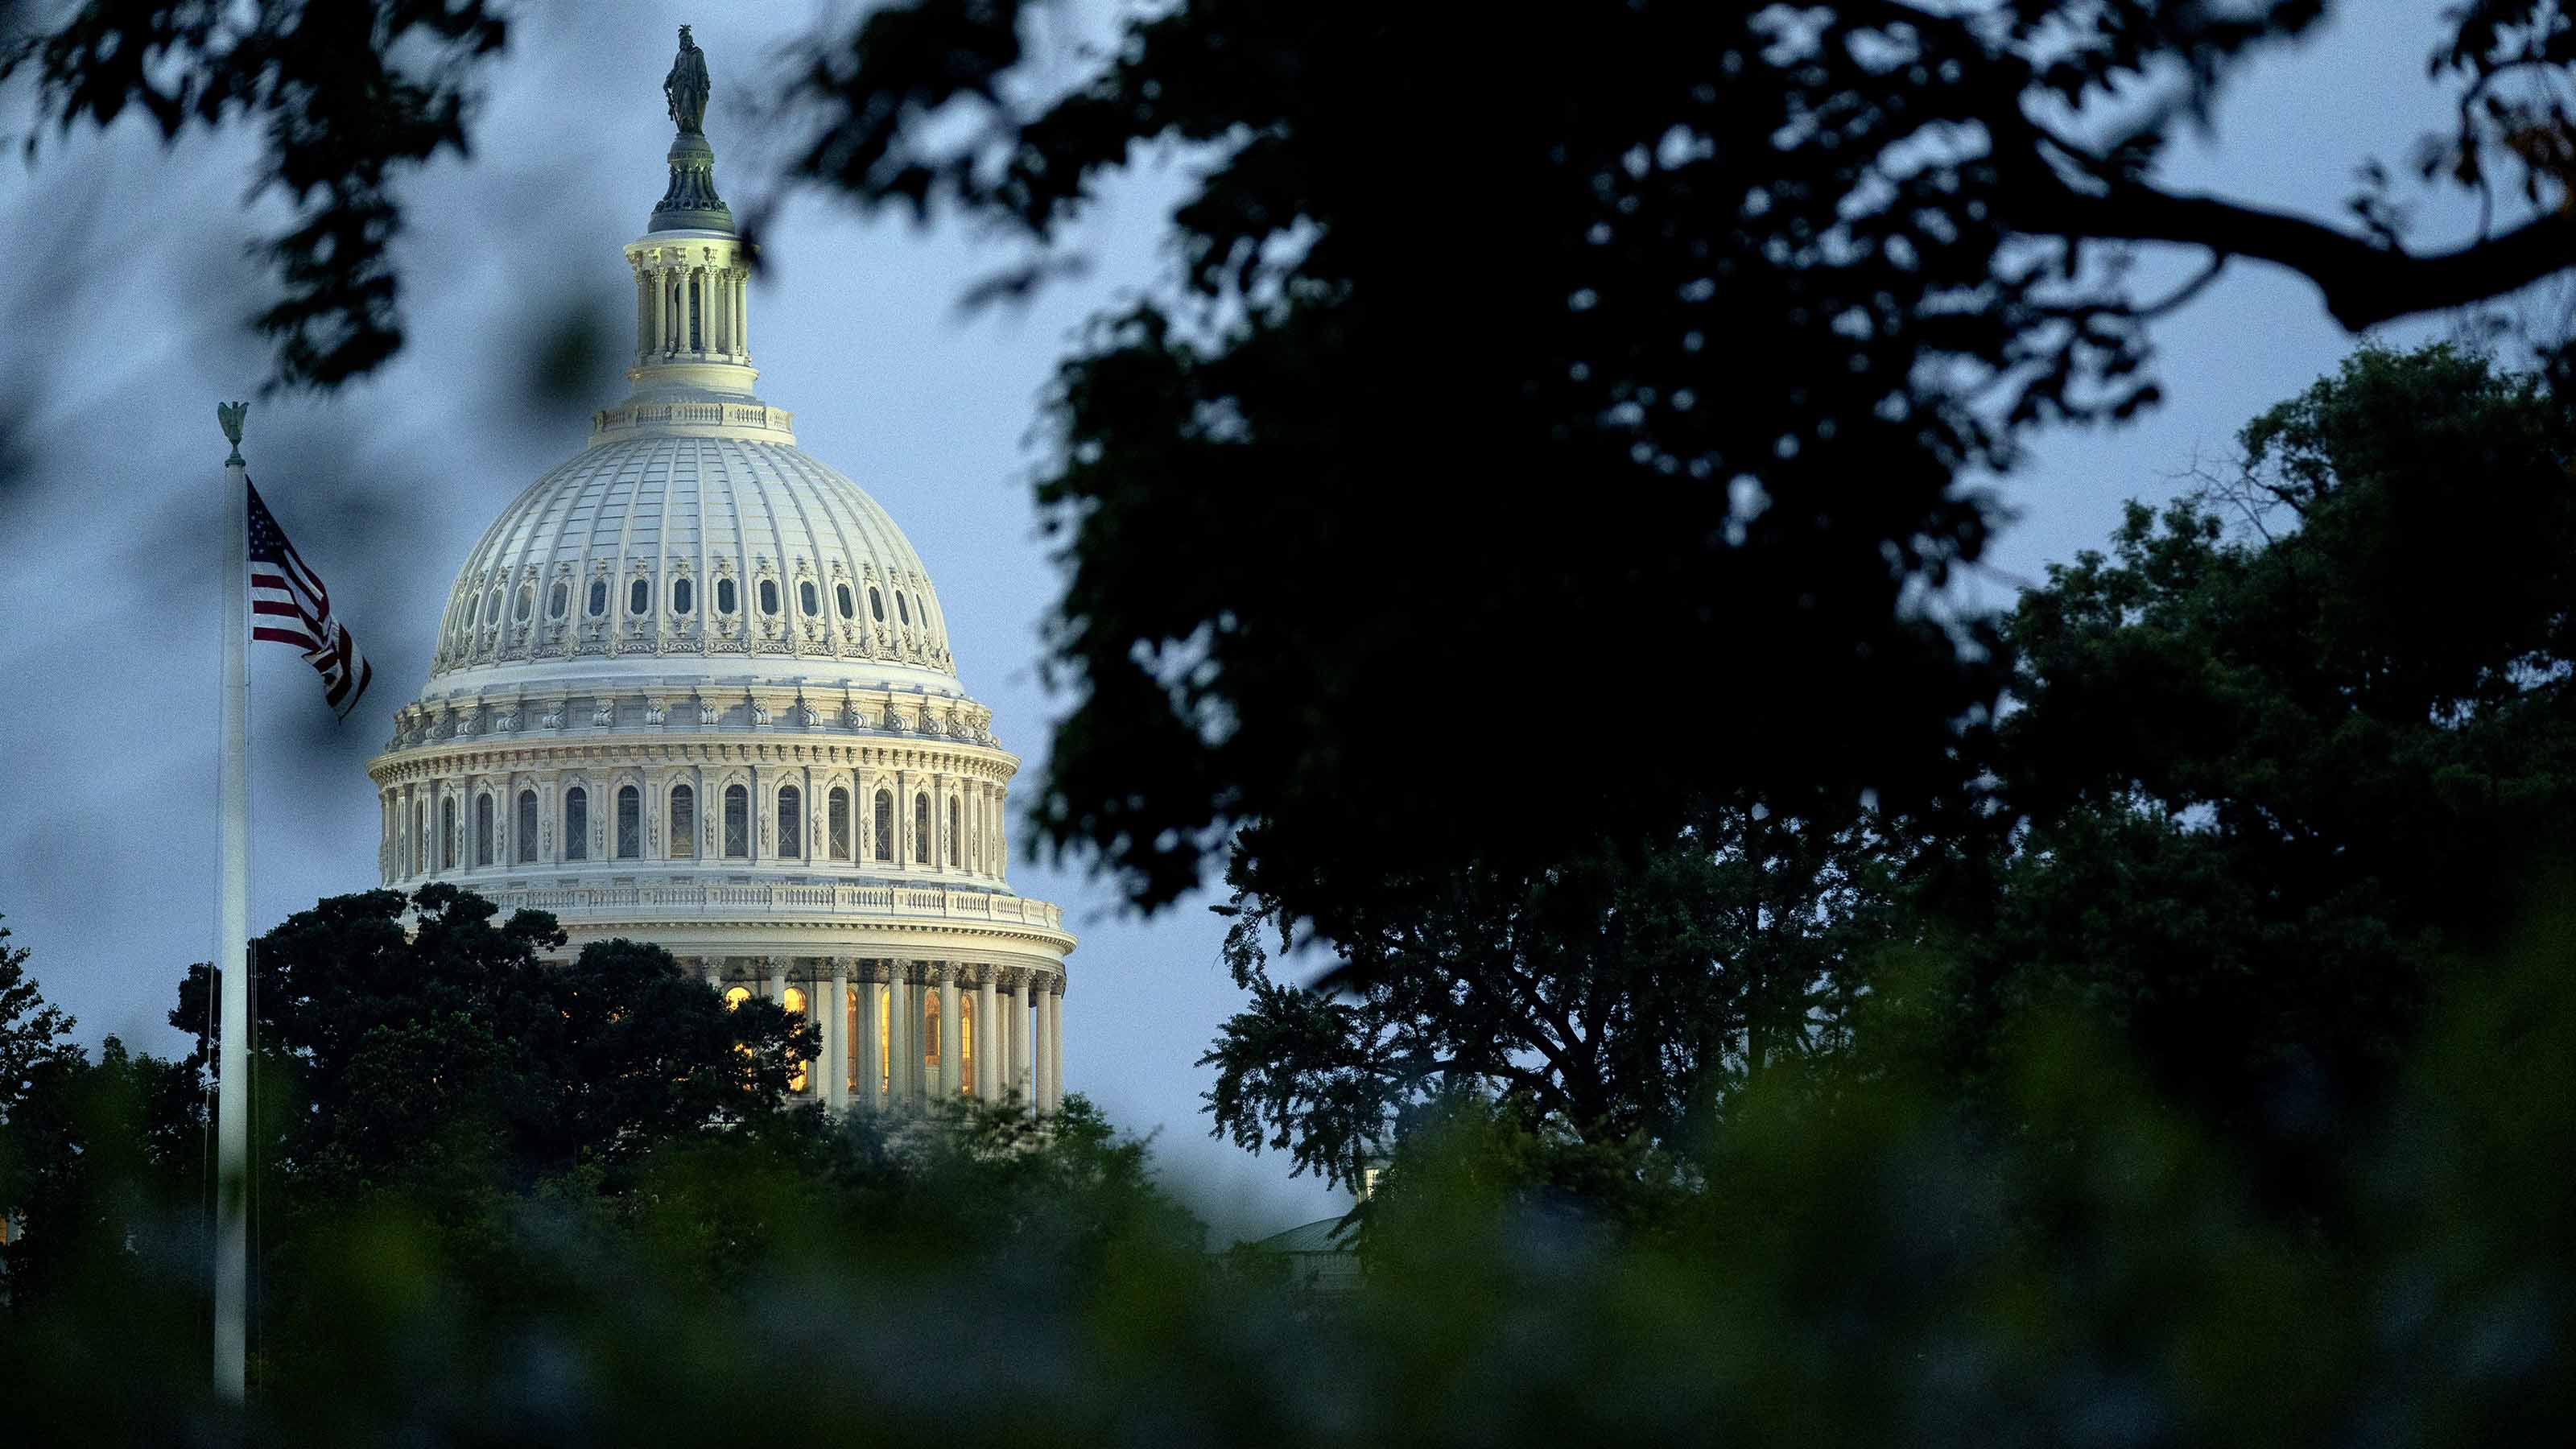 Congress Set for Busy Winter
The Kiplinger Letter The Letter editors review the bills Congress will decide on this year. The government funding bill is paramount, but other issues vie for lawmakers’ attention.
-
 The Kiplinger Letter's 10 Forecasts for 2026
The Kiplinger Letter Here are some of the biggest events and trends in economics, politics and tech that will shape the new year.
-
 What to Expect from the Global Economy in 2026
The Kiplinger Letter Economic growth across the globe will be highly uneven, with some major economies accelerating while others hit the brakes.
-
 Amid Mounting Uncertainty: Five Forecasts About AI
The Kiplinger Letter With the risk of overspending on AI data centers hotly debated, here are some forecasts about AI that we can make with some confidence.
-
 Worried About an AI Bubble? Here’s What You Need to Know
The Kiplinger Letter Though AI is a transformative technology, it’s worth paying attention to the rising economic and financial risks. Here’s some guidance to navigate AI’s future.
-
 Will AI Videos Disrupt Social Media?
The Kiplinger Letter With the introduction of OpenAI’s new AI social media app, Sora, the internet is about to be flooded with startling AI-generated videos.
-
What Services Are Open During the Government Shutdown?
The Kiplinger Letter As the shutdown drags on, many basic federal services will increasingly be affected.


