Rising Household Wealth Signals Surge in Consumer Spending
The rebound is unequal, though, with makers of pricey items set to benefit more than those churning out staples.

Profit and prosper with the best of Kiplinger's advice on investing, taxes, retirement, personal finance and much more. Delivered daily. Enter your email in the box and click Sign Me Up.
You are now subscribed
Your newsletter sign-up was successful
Want to add more newsletters?

Delivered daily
Kiplinger Today
Profit and prosper with the best of Kiplinger's advice on investing, taxes, retirement, personal finance and much more delivered daily. Smart money moves start here.

Sent five days a week
Kiplinger A Step Ahead
Get practical help to make better financial decisions in your everyday life, from spending to savings on top deals.

Delivered daily
Kiplinger Closing Bell
Get today's biggest financial and investing headlines delivered to your inbox every day the U.S. stock market is open.

Sent twice a week
Kiplinger Adviser Intel
Financial pros across the country share best practices and fresh tactics to preserve and grow your wealth.

Delivered weekly
Kiplinger Tax Tips
Trim your federal and state tax bills with practical tax-planning and tax-cutting strategies.

Sent twice a week
Kiplinger Retirement Tips
Your twice-a-week guide to planning and enjoying a financially secure and richly rewarding retirement

Sent bimonthly.
Kiplinger Adviser Angle
Insights for advisers, wealth managers and other financial professionals.

Sent twice a week
Kiplinger Investing Weekly
Your twice-a-week roundup of promising stocks, funds, companies and industries you should consider, ones you should avoid, and why.

Sent weekly for six weeks
Kiplinger Invest for Retirement
Your step-by-step six-part series on how to invest for retirement, from devising a successful strategy to exactly which investments to choose.
Here’s one piece of economic news that bodes well for economic growth in coming months: Household net worth is on the rise. Between a 27% increase in the S&P 500 so far this year and housing prices that are rising at double-digit rates in most major markets, overall gains in household wealth are the strongest since at least 2005, two years before the financial meltdown and housing bust.
Why is that good news for economic growth? Because when consumers are sitting on a bigger stash — whether it’s held in a 401(k) stock portfolio or in the form of more equity in their homes — they tend to spend more, and that contributes to the virtuous economic cycle. More spending spurs more production, more hiring and more income, which in turn fuels even more spending.
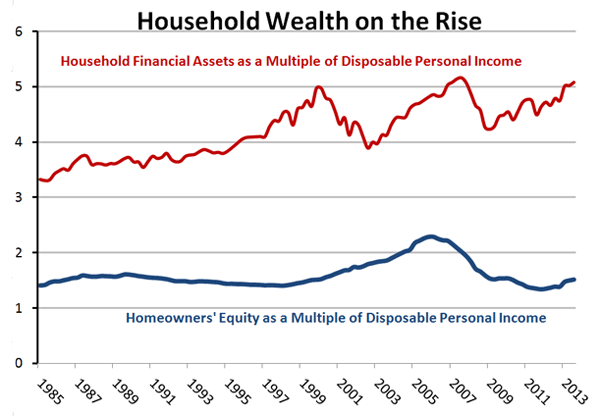
Household net worth has increased dramatically since 2011, jumping $6.0 trillion in 2012 and $6.3 trillion through September 2013 to a total of $77.3 trillion. But to assess the impact of this on the economy, we need to measure wealth by how big it is relative to total disposable personal income. The graph below measures this for the two main components of household wealth, financial assets less liabilities and homeowners’ equity. Financial net worth has been rising steadily since the end of the 2008-2009 recession. Indeed, given the strong stock market performance of recent months, it is probably now at or near the previous peak — roughly 4.8 times disposable personal income. Meanwhile, homeowners’ equity, again measured as a multiple of disposable income, started rising in 2012 for the first time since the housing bubble burst and should soon return to a more “normal” range compared to its historical average.
From just $107.88 $24.99 for Kiplinger Personal Finance
Become a smarter, better informed investor. Subscribe from just $107.88 $24.99, plus get up to 4 Special Issues

Sign up for Kiplinger’s Free Newsletters
Profit and prosper with the best of expert advice on investing, taxes, retirement, personal finance and more - straight to your e-mail.
Profit and prosper with the best of expert advice - straight to your e-mail.

So how much of a bump to spending does more wealth provide? For every $100 increase in their home equity, homeowners save about $3 less for their golden years, instead spending it on movies, meals, apparel, new tech gizmos and hundreds of other goods and services. Similarly, for every $100 increase that consumers see in their financial portfolio, they reduce savings by about $1.50 and spend that.
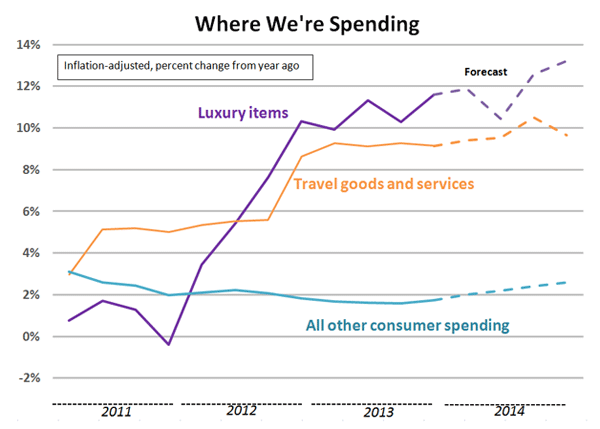
Together, gains in home equity and financial assets could have added an estimated $30 billion to consumer purchases each quarter of the past two years. Consumers feeling wealthier could have especially been responsible for the recent run-up in spending on nonessentials such as luxury items, increased travel (see graph below), sporting and recreational equipment, and hobbies.

Of course, increases in household net worth benefit some types of goods and services a great deal more than others. Household wealth, and gains in it, aren’t distributed evenly across society. They’re concentrated among the very wealthy and the upper middle class. So, gains in the aggregate don’t mean that all consumers are better off. And makers and sellers of luxury items — pricey cars, boats, jewelry, and designer shoes, apparel and accessories, for example — are more likely to be blessed with higher sales than those who produce and sell toothpaste, toilet paper and other consumer staples. Moreover, wealth in the form of increased home equity can’t always be easily tapped. Still, over the past 30 years, the pattern is clear: When wealth rises, consumers as a group loosen their grips on their wallets and pump more bucks into the economy. And that can’t be bad.
Profit and prosper with the best of Kiplinger's advice on investing, taxes, retirement, personal finance and much more. Delivered daily. Enter your email in the box and click Sign Me Up.

David is both staff economist and reporter for The Kiplinger Letter, overseeing Kiplinger forecasts for the U.S. and world economies. Previously, he was senior principal economist in the Center for Forecasting and Modeling at IHS/GlobalInsight, and an economist in the Chief Economist's Office of the U.S. Department of Commerce. David has co-written weekly reports on economic conditions since 1992, and has forecasted GDP and its components since 1995, beating the Blue Chip Indicators forecasts two-thirds of the time. David is a Certified Business Economist as recognized by the National Association for Business Economics. He has two master's degrees and is ABD in economics from the University of North Carolina at Chapel Hill.
-
 Dow Leads in Mixed Session on Amgen Earnings: Stock Market Today
The rest of Wall Street struggled as Advanced Micro Devices earnings caused a chip-stock sell-off.
-
 How to Watch the 2026 Winter Olympics Without Overpaying
Here’s how to stream the 2026 Winter Olympics live, including low-cost viewing options, Peacock access and ways to catch your favorite athletes and events from anywhere.
-
 Here’s How to Stream the Super Bowl for Less
We'll show you the least expensive ways to stream football's biggest event.
-
 U.S. Manufacturing Is Already Ailing from Coronavirus
Economic Forecasts Supplies are hard to come by, and in the longer-term demand may be at risk.
-
 Will You Have to Pay More Sales Taxes on Your Online Purchases?
business One thing’s for sure: Consumers who live in one of the five states without a sales tax won’t be affected by the Supreme Court’s ruling.
-
 What to Expect From the New Fed Chief
Economic Forecasts By and large, Jerome Powell will move along the path set by his predecessor.
-
 How a Border Tax Would Affect You
Business Costs & Regulation A plan to limit imports could raise prices but also create more jobs.
-
 A Housing Shortage Looms: Builders Can’t Keep Up
business Starter homes especially are becoming scarce.
-
 Help Wanted in America: Skilled Workers
Technology In an ever-more-competitive job market, technology increases the need for skilled workers.
-
 The Unintended Consequences of a Boost in Overtime Pay
Business Costs & Regulation New rules mean millions more employees will be overtime-eligible. But will employers find workarounds?
-
 U.S. Economy to Perk Up in Second Half
Economic Forecasts Consumers are recovering from a swoon induced by a wobbly stock market. But energy, other sectors will continue to struggle.