What the U.S. Dollar Can Tell Investors About Oil Prices
Watch the Fed and U.S. dollar to figure out if and when oil may bottom and start to recover.

Profit and prosper with the best of Kiplinger's advice on investing, taxes, retirement, personal finance and much more. Delivered daily. Enter your email in the box and click Sign Me Up.
You are now subscribed
Your newsletter sign-up was successful
Want to add more newsletters?

Delivered daily
Kiplinger Today
Profit and prosper with the best of Kiplinger's advice on investing, taxes, retirement, personal finance and much more delivered daily. Smart money moves start here.

Sent five days a week
Kiplinger A Step Ahead
Get practical help to make better financial decisions in your everyday life, from spending to savings on top deals.

Delivered daily
Kiplinger Closing Bell
Get today's biggest financial and investing headlines delivered to your inbox every day the U.S. stock market is open.

Sent twice a week
Kiplinger Adviser Intel
Financial pros across the country share best practices and fresh tactics to preserve and grow your wealth.

Delivered weekly
Kiplinger Tax Tips
Trim your federal and state tax bills with practical tax-planning and tax-cutting strategies.

Sent twice a week
Kiplinger Retirement Tips
Your twice-a-week guide to planning and enjoying a financially secure and richly rewarding retirement

Sent bimonthly.
Kiplinger Adviser Angle
Insights for advisers, wealth managers and other financial professionals.

Sent twice a week
Kiplinger Investing Weekly
Your twice-a-week roundup of promising stocks, funds, companies and industries you should consider, ones you should avoid, and why.

Sent weekly for six weeks
Kiplinger Invest for Retirement
Your step-by-step six-part series on how to invest for retirement, from devising a successful strategy to exactly which investments to choose.
Won't $0.99 per gallon of gasoline be great? That is what some "experts" predict for the summer of 2016. Maybe it will happen; maybe it won't. What is for sure is that the price of oil has collapsed over the past year, and many U.S. oil companies have gone out of business.
So why did the price of oil drop so much? Was it overproduction from Saudi Arabia? Was it declining global consumption?
3 Myths About Why Oil Prices Dropped
1. Saudi Arabia's overproduction.
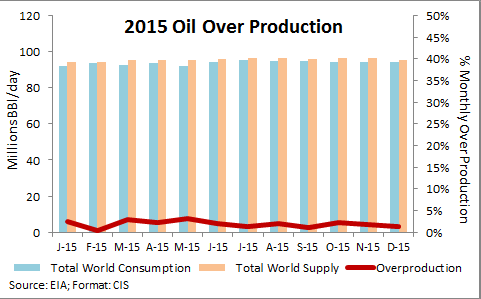
Yes, it is true that Saudi Arabian oil producers have been increasing output. But since the price of oil collapsed, the Organization of the Petroleum Exporting Countries (OPEC) increased its production by only 3.95%, according to data from the U.S. Energy Information Administration (EIA). World production was up 2.23% during the same period, according to the EIA. So yes, OPEC was producing oil at a faster rate than the rest of the world, but does a 3.95% increase really translate into a 75% decline in the price of oil? We don't think a 3.95% increase in supply justifies a 75% price decline. So it must be something else.
From just $107.88 $24.99 for Kiplinger Personal Finance
Become a smarter, better informed investor. Subscribe from just $107.88 $24.99, plus get up to 4 Special Issues

Sign up for Kiplinger’s Free Newsletters
Profit and prosper with the best of expert advice on investing, taxes, retirement, personal finance and more - straight to your e-mail.
Profit and prosper with the best of expert advice - straight to your e-mail.

2. Consumption has dropped significantly.
Where? In the U.S.? China? Europe? EIA data shows that global consumption since the peak price in June 2014 has been up 0.89% (or about 0.50%, annualized). Yes, this growth in annual consumption is slower than the average since 2000, which has been 1.27% annually, according to data from oil giant BP. So since mid 2014, consumption did not decline. It actually increased, albeit at a rate about 0.77% slower than average. Does a 0.77% decline in the growth rate really justify a 75% drop in the price of oil? No, we don't think so either. So it must be something else.
3. U.S. oil companies' troubles.
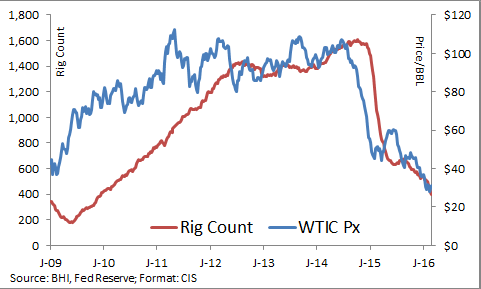
Rig counts have collapsed over the past year or so. According to oil field services company Baker Hughes, the number of rigs dropped from 1,609 in October 2014 to 400 in February 2016, a decline of 75%. This crash in rig counts indicates that U.S. oil companies didn't start failing until October 2014 at the earliest. But the price of oil started crashing earlier, in June 2014. Rig counts dropped due to the price of oil, not the other way around. (Of course some went under for reasons other than the oil price drop.)

Why Oil Prices Really Collapsed
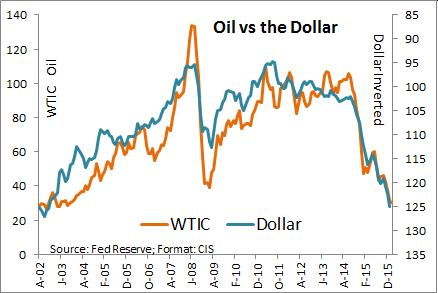
In reality, the most likely candidate for why oil prices collapsed is the rise of the U.S. dollar. Oil is priced in dollars. And since June 2014, according to the Federal Reserve, the dollar has rallied 21%. As the chart below shows, if you invert the dollar, it parallels the decline in the price of oil. This is most likely the catalyst for the price decline.

So why did the U.S. dollar rally? Wasn't it the Fed's mandate to maintain price stability? Besides hurting the price of oil, a rising dollar hurts U.S. exports. Since June 2014, exports have declined 10%, according to the Federal Reserve's own data. Since the rising dollar hurt the price of oil, it has also decimated the oil business in the U.S.
Why did the Fed drop the ball on the dollar? Did they not see how it would impact the price of oil? They intervened to keep interest rates low and to keep stock prices from collapsing. But what happened with the U.S. dollar? This oversight indicates a lack of leadership and control at the Fed.
The fallout from the U.S. dollar's rally has been the decline in the price of many commodities, not just oil, troubles in the emerging markets since much of their debt was priced in U.S. dollars and a decline in U.S. exports. In my opinion, the Fed is directly responsible for the U.S. dollar's rally and the resulting problems.
So what does this mean? Eventually the dollar should come back to where it belongs, at a level much lower than the current price. This should benefit exports, the U.S. economy in general, the price of oil and other commodities and the emerging markets. But in the meantime, the Fed may allow the dollar to rally further. So the key is to watch the U.S. dollar.
What does an investor do? Realize that the current situation with anything that is related to the price of the U.S. dollar is in a temporary, artificially manipulated state. However, oil may bottom, and maybe even recover, sooner than many think. This is due to the production curve of oil wells.

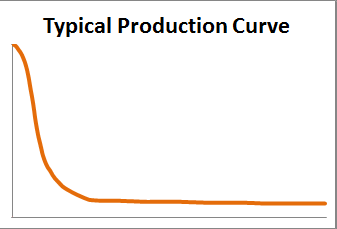
Many people think that once a well is drilled, oil comes out in a continuous flow. That isn't the case. The typical production curve for a well is a steep drop in the first few years until it flattens out, producing maybe only 10% to 20% of the first year's production each year for the next 20 years or more.
If you look at the chart earlier in this column that compares the number of rigs with the price of oil, you will see that the rig count peaked a little over a year ago. This means the production of the last rigs that came online may soon decline rapidly. After years of rising production, the U.S. could see declining production in the next few months. This could put a floor on the price of oil. If the production decline is steep enough, it may actually offset the U.S. dollar's rally. Even if it does continue to rally, the impact on the price of oil may not be as bad as it has been over the past 18 months.
The key is still the U.S. dollar, but if U.S. oil production starts to decline, it may signal that the worst for oil prices may be over.
John Riley, registered Research Analyst and the Chief Investment Strategist at CIS, has been defending his clients from the surprises Wall Street misses since 1999.
Disclosure: Third party posts do not reflect the views of Cantella & Co Inc. or Cornerstone Investment Services, LLC. Any links to third party sites are believed to be reliable but have not been independently reviewed by Cantella & Co. Inc or Cornerstone Investment Services, LLC. Securities offered through Cantella & Co., Inc., Member FINRA/SIPC. Advisory Services offered through Cornerstone Investment Services, LLC's RIA. Please refer to my website for states in which I am registered.
Profit and prosper with the best of Kiplinger's advice on investing, taxes, retirement, personal finance and much more. Delivered daily. Enter your email in the box and click Sign Me Up.

In 1999, John Riley established Cornerstone Investment Services to offer investors an alternative to Wall Street. He is unique among financial advisers for having passed the Series 86 and 87 exams to become a registered Research Analyst. Since breaking free of the crowd, John has been able to manage clients' money in a way that prepares them for the trends he sees in the markets and the surprises Wall Street misses.
-
 5 Vince Lombardi Quotes Retirees Should Live By
The iconic football coach's philosophy can help retirees win at the game of life.
-
 The $200,000 Olympic 'Pension' is a Retirement Game-Changer for Team USA
The donation by financier Ross Stevens is meant to be a "retirement program" for Team USA Olympic and Paralympic athletes.
-
 10 Cheapest Places to Live in Colorado
Property Tax Looking for a cozy cabin near the slopes? These Colorado counties combine reasonable house prices with the state's lowest property tax bills.
-
 Don't Bury Your Kids in Taxes: How to Position Your Investments to Help Create More Wealth for Them
To minimize your heirs' tax burden, focus on aligning your investment account types and assets with your estate plan, and pay attention to the impact of RMDs.
-
 Are You 'Too Old' to Benefit From an Annuity?
Probably not, even if you're in your 70s or 80s, but it depends on your circumstances and the kind of annuity you're considering.
-
 In Your 50s and Seeing Retirement in the Distance? What You Do Now Can Make a Significant Impact
This is the perfect time to assess whether your retirement planning is on track and determine what steps you need to take if it's not.
-
 Your Retirement Isn't Set in Stone, But It Can Be a Work of Art
Setting and forgetting your retirement plan will make it hard to cope with life's challenges. Instead, consider redrawing and refining your plan as you go.
-
 The Bear Market Protocol: 3 Strategies to Consider in a Down Market
The Bear Market Protocol: 3 Strategies for a Down Market From buying the dip to strategic Roth conversions, there are several ways to use a bear market to your advantage — once you get over the fear factor.
-
 For the 2% Club, the Guardrails Approach and the 4% Rule Do Not Work: Here's What Works Instead
For retirees with a pension, traditional withdrawal rules could be too restrictive. You need a tailored income plan that is much more flexible and realistic.
-
 Retiring Next Year? Now Is the Time to Start Designing What Your Retirement Will Look Like
This is when you should be shifting your focus from growing your portfolio to designing an income and tax strategy that aligns your resources with your purpose.
-
 I'm a Financial Planner: This Layered Approach for Your Retirement Money Can Help Lower Your Stress
To be confident about retirement, consider building a safety net by dividing assets into distinct layers and establishing a regular review process. Here's how.