Is Your Dividend Growth Strategy Stuck in the Past?
Focusing on companies with strong dividend histories makes sense for investors, but that's only part of the equation. Size matters when you're talking about dividend growth.


Profit and prosper with the best of Kiplinger's advice on investing, taxes, retirement, personal finance and much more. Delivered daily. Enter your email in the box and click Sign Me Up.
You are now subscribed
Your newsletter sign-up was successful
Want to add more newsletters?

Delivered daily
Kiplinger Today
Profit and prosper with the best of Kiplinger's advice on investing, taxes, retirement, personal finance and much more delivered daily. Smart money moves start here.

Sent five days a week
Kiplinger A Step Ahead
Get practical help to make better financial decisions in your everyday life, from spending to savings on top deals.

Delivered daily
Kiplinger Closing Bell
Get today's biggest financial and investing headlines delivered to your inbox every day the U.S. stock market is open.

Sent twice a week
Kiplinger Adviser Intel
Financial pros across the country share best practices and fresh tactics to preserve and grow your wealth.

Delivered weekly
Kiplinger Tax Tips
Trim your federal and state tax bills with practical tax-planning and tax-cutting strategies.

Sent twice a week
Kiplinger Retirement Tips
Your twice-a-week guide to planning and enjoying a financially secure and richly rewarding retirement

Sent bimonthly.
Kiplinger Adviser Angle
Insights for advisers, wealth managers and other financial professionals.

Sent twice a week
Kiplinger Investing Weekly
Your twice-a-week roundup of promising stocks, funds, companies and industries you should consider, ones you should avoid, and why.

Sent weekly for six weeks
Kiplinger Invest for Retirement
Your step-by-step six-part series on how to invest for retirement, from devising a successful strategy to exactly which investments to choose.
The potential power of stock dividends can go a long way for investors. For some, dividend payouts generate income, and for others, dividends are an indicator of a stock’s quality. If a company maintains a long track record of paying dividends, investors may see more stability in growth. Likewise, if a stock makes headlines by cutting or suspending its dividend, investors may panic and could be in for a volatile ride — just look at what happened to GE and Mattel recently.
Certain asset managers use dividend history in an attempt to create a shortlist of potentially high-quality stocks. A number of dividend indexes exist, which filter the large-cap universe down to a group of stocks with 10 to 25 years of consecutive dividend increases. But is this methodology truly effective? Or are these older methods of measuring dividend stock health stuck in the past?
At Reality Shares, our in-depth research into dividend growth investing led to the creation of our very own dividend growth health and rating methodology, allowing us to determine whether these shortlists of dividend-paying stocks are effective in measuring stock quality and resiliency.
From just $107.88 $24.99 for Kiplinger Personal Finance
Become a smarter, better informed investor. Subscribe from just $107.88 $24.99, plus get up to 4 Special Issues

Sign up for Kiplinger’s Free Newsletters
Profit and prosper with the best of expert advice on investing, taxes, retirement, personal finance and more - straight to your e-mail.
Profit and prosper with the best of expert advice - straight to your e-mail.
Rearview Investing Can Be Dangerous
Stocks with a decades-long track record of consistent dividend payouts are impressive. It’s great to see a blue-chip stock living up to its reputation of reliable dividends. But, as a former financial advisor myself, I’m constantly reminded of the proverb, “past performance does not guarantee future results.”
This also applies to dividend investing. A long dividend history is just one dividend payment away from a broken track record. Stock markets are described as leading indicators of a stock’s health, where current market prices reflect investors’ expectations for the future of the market. Solely using past dividend activity is backward-looking, and it doesn't provide much insight into future performance. Investors are unprotected when they are only observing past performance.
Size Does Matter
Time-honored dividend stock lists also miss the magnitude of potential dividend growth. If a stock raised its dividend one penny for each of the last 10 years in a row, does it indicate an improving ability to maximize investor returns? We think the actual magnitude of dividend growth is critically important, as it potentially echoes an improvement in the fundamentals driven by earnings growth or greater cash flow.
We saw this during the second quarter. After successful bank stress tests in June, Citibank doubled its dividend and Bank of America increased its dividend by 60%, reflecting increased stability and positive remarks from the Federal Reserve. Our research shows that a history of strong dividend increases can be a better measure of future total return potential rather than simply incremental ones.
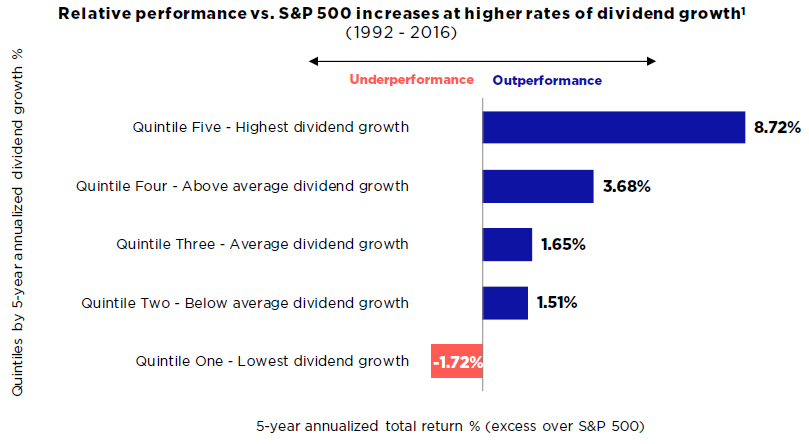
My company’s research shows that many dividend track record-focused indexes are actually weighted by each stock’s corresponding dividend yield. In many cases, the higher the yield, the bigger the stock’s weighting. But, dividend yield can be a function of a recent stock decline, and it may not give a strong indication of a company’s quality. After looking at Bloomberg data between 1992 and 2016, we see that companies with the highest dividend yields actually underperformed the broad equity market on a total return basis.

Source: Bloomberg, Reality Shares Research. Past performance does not guarantee future results. Dividend growth quintiles are based on 5-year dividend growth for the universe of dividend payers among the top 2,000 stocks by market capitalization. The full 25-year time period is broken up into five non-overlapping 5-year segments ending 12/31/1996, 12/31/2001, 12/31/2006, 12/31/2011, and 12/31/2016, then aggregated. Data was normalized across time frames by subtracting relevant 5-year dividend growth and 5-year total return rates of the S&P 500 index. Quintile 1 includes dividend cutters and stocks with no dividend change. Over the full period, there were 640 instances in the first quintile. Of these 295 (46%) were cutters and 116 (18%) were non-growers. 3,166 instances of non-payers.
We don’t find dividend yield to be very useful when building your total return portfolio, as it does not reflect the state of a stock’s balance sheet or income statement.
The Test of Volatile Times
October marked the 10-year anniversary of the market top just before the Great Recession. After this peak, many well-known stocks fell prey to market weakness and cut dividends. Some of the companies even went bankrupt. In this case, investors who looked at dividend yield or how many consecutive dividend payouts a stock made likely didn’t spot signs of trouble. Hallmark stocks lost value, unpleasantly surprising loyal shareholders. Investors learned the hard way that a multi-year track record of incremental dividend increases does not indicate a stock is resistant to declines. That requires a more rigorous approach to dividend growth investing.
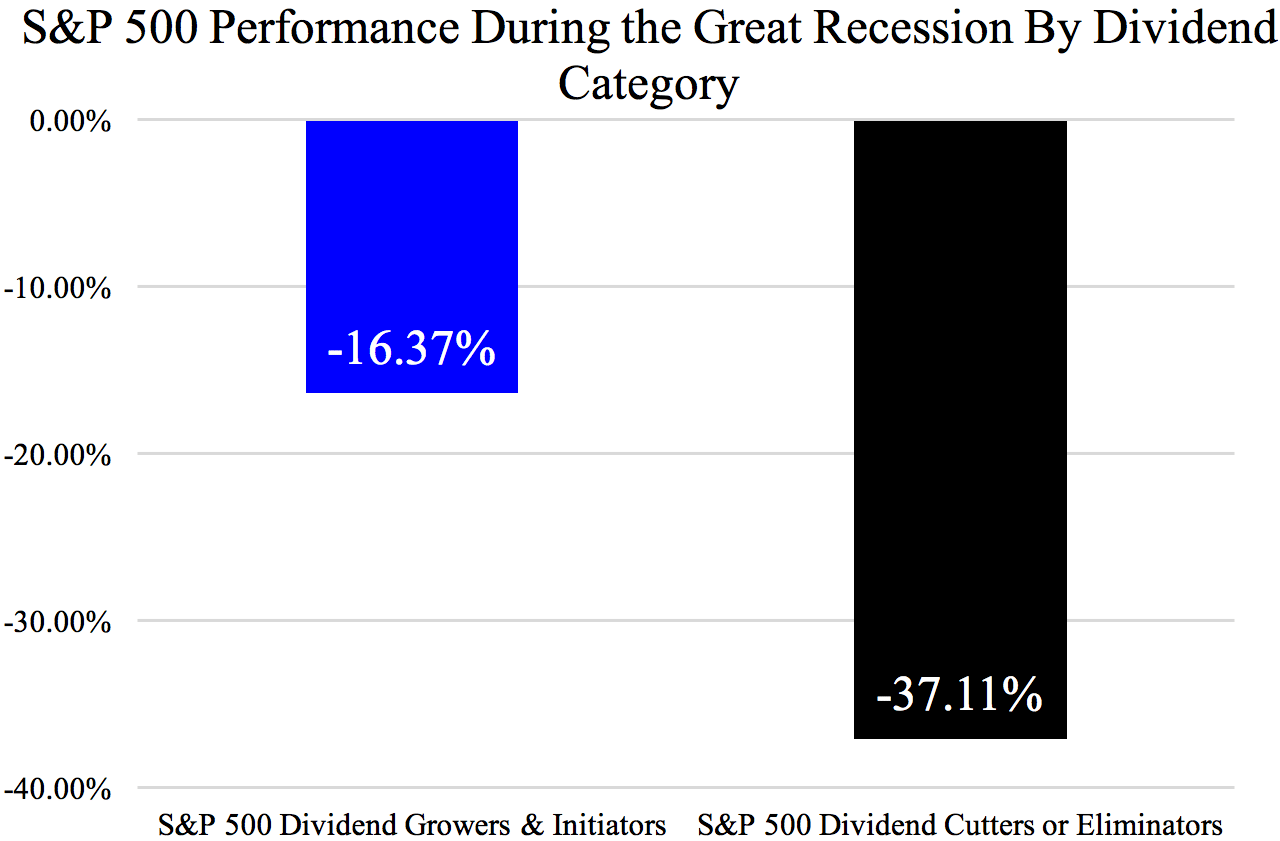
In different market environments, stocks that can maintain their dividend growth rates have the potential to outperform stocks with stagnant dividend growth, or dividend cuts. Dividend growers often possess solid fundamentals and have the potential to generate strong returns during bull markets, and they may show more resilience during market declines, as the chart below illustrates.

Data from 1/31/72 – 10/31/17. Source: Ned Davis Research Inc. Dividend policy constituents are calculated on a rolling 12-month basis and rebalanced monthly. Category returns are calculated on a monthly basis. Shown for illustrative purposes only. Past performance is not indicative of future returns. Dividend Growers & Initiators category represents historical performance for companies that either increased or initiated their dividend distribution. Dividend Cutters & Eliminators category represents historical performance for companies that either cut or eliminated their dividend distribution. Equal Weighted category represents historical performance for the 500 largest U.S. stocks by market cap, calculated by assigning the same weighting (0.20%) to each constituent. Non-Dividend Payers category represents historical performance for companies that do not pay a dividend. Bull markets are defined as S&P 500 Index 12-month rolling periods with performance greater than 12%; bear markets as S&P 500 Index 12-month rolling periods with performance less than -6%.
Seek Dividend Growth Leaders
Since dividends are derived from a stock’s underlying earnings, investors can use dividend activity to better forecast a stock’s future prospects. Company dividends are a function of many important factors, including free cash flow, buybacks and earnings forecasts. A dividend growth investing strategy that can potentially maximize investor returns should take these factors into account.
Investing in stocks with the highest rates of dividend growth — what we call dividend growth leaders — puts investors in a stronger position to potentially outperform the market.
Reality Shares developed an analytical tool called DIVCON to evaluate dividend health. It ranks a company’s ability to increase or decrease its future dividends by evaluating seven factors. The methodology seeks to deliver a more accurate picture of a company’s financial health and better predict the probability of an increase or decrease in a company’s dividend over the next 12 months. These factors help DIVCON identify future prospects rather than past dividend changes.
Our research has found that stocks with the highest rates of dividend growth have historically outperformed the market. Our emphasis on dividend growth investing involves vigorously analyzing the drivers of stock price growth and company health.
A small change in approach can make a big difference in your dividend growth investing. Instead of only looking at how long a stock has been paying dividends, seek dividend growth leaders for a potentially better strategy in many market environments.
Learn more about how we rank and analyze dividend-paying stocks using advanced analytics and find important disclosures at Realityshares.com.
Profit and prosper with the best of Kiplinger's advice on investing, taxes, retirement, personal finance and much more. Delivered daily. Enter your email in the box and click Sign Me Up.

Eric Ervin founded Reality Shares, a firm known for ETF industry innovation. He led the launch of investment analytics tools, including Blockchain Score™, a blockchain company evaluation system; DIVCON®, a dividend health analysis system; and the Guard Indicator, a directional market indicator. These tools were designed to help investors access innovative investment strategies as well as provide alternative dividend investment solutions to manage risk.
-
 5 Vince Lombardi Quotes Retirees Should Live By
The iconic football coach's philosophy can help retirees win at the game of life.
-
 The $200,000 Olympic 'Pension' is a Retirement Game-Changer for Team USA
The donation by financier Ross Stevens is meant to be a "retirement program" for Team USA Olympic and Paralympic athletes.
-
 10 Cheapest Places to Live in Colorado
Property Tax Looking for a cozy cabin near the slopes? These Colorado counties combine reasonable house prices with the state's lowest property tax bills.
-
 Don't Bury Your Kids in Taxes: How to Position Your Investments to Help Create More Wealth for Them
To minimize your heirs' tax burden, focus on aligning your investment account types and assets with your estate plan, and pay attention to the impact of RMDs.
-
 Are You 'Too Old' to Benefit From an Annuity?
Probably not, even if you're in your 70s or 80s, but it depends on your circumstances and the kind of annuity you're considering.
-
 In Your 50s and Seeing Retirement in the Distance? What You Do Now Can Make a Significant Impact
This is the perfect time to assess whether your retirement planning is on track and determine what steps you need to take if it's not.
-
 Your Retirement Isn't Set in Stone, But It Can Be a Work of Art
Setting and forgetting your retirement plan will make it hard to cope with life's challenges. Instead, consider redrawing and refining your plan as you go.
-
 The Bear Market Protocol: 3 Strategies to Consider in a Down Market
The Bear Market Protocol: 3 Strategies for a Down Market From buying the dip to strategic Roth conversions, there are several ways to use a bear market to your advantage — once you get over the fear factor.
-
 For the 2% Club, the Guardrails Approach and the 4% Rule Do Not Work: Here's What Works Instead
For retirees with a pension, traditional withdrawal rules could be too restrictive. You need a tailored income plan that is much more flexible and realistic.
-
 Retiring Next Year? Now Is the Time to Start Designing What Your Retirement Will Look Like
This is when you should be shifting your focus from growing your portfolio to designing an income and tax strategy that aligns your resources with your purpose.
-
 I'm a Financial Planner: This Layered Approach for Your Retirement Money Can Help Lower Your Stress
To be confident about retirement, consider building a safety net by dividing assets into distinct layers and establishing a regular review process. Here's how.