Invest with Your Eyes Wide Open
Are you prepared for volatility? Before you make an investment, look carefully at its track record by asking these five questions.


Profit and prosper with the best of Kiplinger's advice on investing, taxes, retirement, personal finance and much more. Delivered daily. Enter your email in the box and click Sign Me Up.
You are now subscribed
Your newsletter sign-up was successful
Want to add more newsletters?

Delivered daily
Kiplinger Today
Profit and prosper with the best of Kiplinger's advice on investing, taxes, retirement, personal finance and much more delivered daily. Smart money moves start here.

Sent five days a week
Kiplinger A Step Ahead
Get practical help to make better financial decisions in your everyday life, from spending to savings on top deals.

Delivered daily
Kiplinger Closing Bell
Get today's biggest financial and investing headlines delivered to your inbox every day the U.S. stock market is open.

Sent twice a week
Kiplinger Adviser Intel
Financial pros across the country share best practices and fresh tactics to preserve and grow your wealth.

Delivered weekly
Kiplinger Tax Tips
Trim your federal and state tax bills with practical tax-planning and tax-cutting strategies.

Sent twice a week
Kiplinger Retirement Tips
Your twice-a-week guide to planning and enjoying a financially secure and richly rewarding retirement

Sent bimonthly.
Kiplinger Adviser Angle
Insights for advisers, wealth managers and other financial professionals.

Sent twice a week
Kiplinger Investing Weekly
Your twice-a-week roundup of promising stocks, funds, companies and industries you should consider, ones you should avoid, and why.

Sent weekly for six weeks
Kiplinger Invest for Retirement
Your step-by-step six-part series on how to invest for retirement, from devising a successful strategy to exactly which investments to choose.
Many investors are convinced that their investment portfolios should always go up. When returns don’t meet these unrealistic expectations, they tend to throw in the towel. It’s a mistake to sell good investments just because they are having a sluggish year or struggling through a bear market. You need to invest with your eyes wide open, knowing beforehandwhat to expect from your investments in both bull and bear markets. In most cases, when your investments take near-term dips, or fluctuate with the market, you should stay invested and hold on.
Most investors ask only one question before buying a portfolio of investments: “What will my return be?” Usually, they answer this by looking at recently posted one-year returns. Stopping at this question will likely leave you disappointed at some point during your investment journey.
In addition to knowing what the returns of your investments have been recently, be sure to ask the following:
From just $107.88 $24.99 for Kiplinger Personal Finance
Become a smarter, better informed investor. Subscribe from just $107.88 $24.99, plus get up to 4 Special Issues

Sign up for Kiplinger’s Free Newsletters
Profit and prosper with the best of expert advice on investing, taxes, retirement, personal finance and more - straight to your e-mail.
Profit and prosper with the best of expert advice - straight to your e-mail.
- What has the portfolio returned on average over the past one, three, five and 10 years?
- What was the best and worst three-month period during the past 10 years?
- What was the best and worst one-year period during the past 10 years?
- What was the best and worst three-year period during the past 10 years?
- How has the investment performed during past wars, bear markets, terrorist attacks and elections?
As an example, let’s answer these questions assuming you had a moderate portfolio consisting of 75% stocks and 25% bonds, such as a combo of Vanguard Total Stock Market Index Fund (Ticker: VTSMX) and Vanguard Total Bond Market Index Fund (VBMFX), rebalanced annually. You would have enjoyed an average return of 11.98%, 7.43%, 11.14%, and 7.06% over the past one, three, five and 10 years (according to Morningstar) for the period ending 8/31/2017. However, to obtain that 7.06% 10-year return you would have had to endure a worst three-month period watching the portfolio fall 23.45%, a worst one-year period with a drop of 32.03%, and a three-year period that lost 3.98% per year. For the 10-year period ending 8/31/2017, a $500,000 investment into this portfolio would now be worth $999,194.
Once you know the answers to these questions, you can then ask yourself an even more significant question: “If I want the long-term returns this investment or portfolio can produce, can I withstand the volatility?”
Without understanding this risk from the onset, volatility will likely get the best of you somewhere down the road.
Let’s investigate the market’s ups and downs during different periods.
The chart below compares eight different investors. All began investing on Jan. 1, 2008, with $500,000. The first four investors took withdrawals of $20,000 per year starting in 2008. The last four investors didn’t take any withdrawals. You’ll notice how much their portfolios fell in 2008-09 and how long it took to get back to $500,000. Based on this chart you can ask yourself which portfolio is closest to yours and whether or not you could handle similar volatility in the future. This was a really poor period in market history, however, you’ll notice that all the portfolios rebounded after 2008 and went on to provide modest returns.
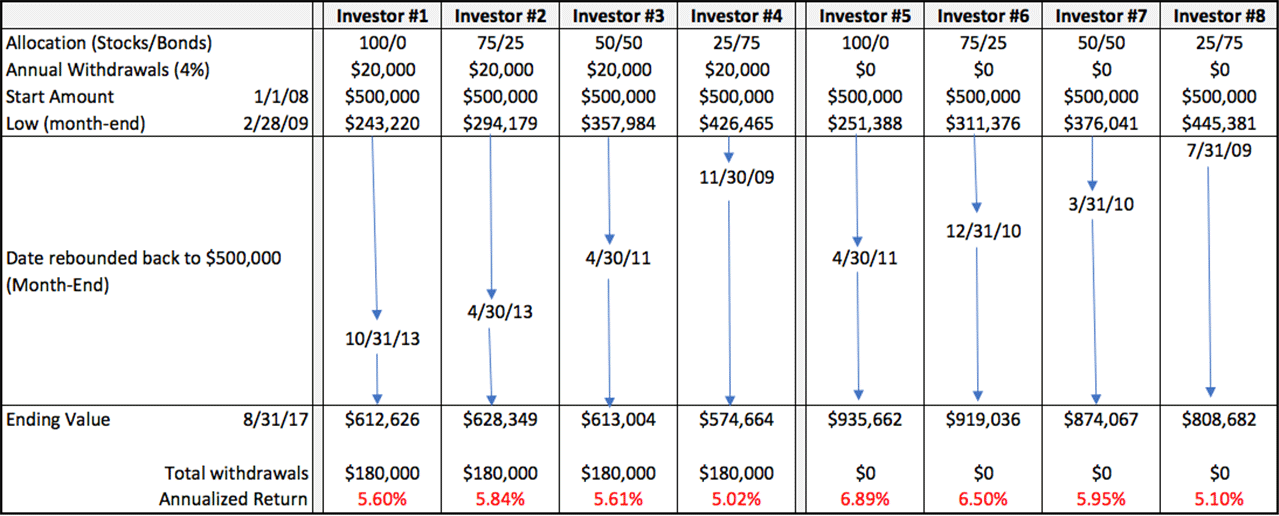
Remember to take downturns in context. Listed below are the worst one-year results for different segments of the stock and bond markets from 1970 to 2016. For example, during the 1973–1974 recession, large-company stocks fell 37%. An investor would have been shortsighted to have sold a portfolio of large-company stocks after these poor-performing years. In thefollowing two years (1975–1976), large-company stocks provided patient investors with 37% and 24% returns, respectively. A $10,000 investment in an S&P 500-stock index fund starting in January 1970 would have grown to $1,002,783 by December 2016, a return of 10.30% per year.
Risk and Return of the Stock and Bond Markets
| 1970-2016 | ||
|---|---|---|
| Asset Class | Annual Rate of Return | Worst Year |
| Large-Company U.S. Stocks | 10% | -37% |
| Small-Company U.S. Stocks | 12% | -38% |
| International Stocks | 9% | -43% |
| Long-Term Corporate Bonds | 9% | -7% |
| Long-Term Government Bonds | 9% | -12% |
| U.S. Treasury Bills | 5% | 0.03% |
Let’s examine risk further by looking at drops occurring during market downturns, wars and terrorism. Again, the question in mind is: If we had similar volatility in the future, could I handle it?
Market Downturns
| S&P 500 Index | ||||
|---|---|---|---|---|
| Market Downturn | Row 0 - Cell 1 | Total Months | Total Return S&P 500 | Total Return One Year Later |
| Begin | End | Row 1 - Cell 2 | Row 1 - Cell 3 | Row 1 - Cell 4 |
| Jun 15 '48 | Jun 13 '49 | 12.1 | -20.6% | 42.1% |
| Aug 2 '56 | Oct 22 '57 | 14.9 | -21.5% | 31.0% |
| Dec 12 '61 | Jun 25 '62 | 6.5 | -27.8% | 32.3% |
| Feb 9 '66 | Oct 7 '66 | 8 | -22.2% | 33.2% |
| Nov 29 '68 | May 26 '70 | 18.1 | -36.1% | 43.7% |
| Jan 11 '73 | Oct 3 '74 | 21 | -48.2% | 38.0% |
| Nov 28 '80 | Aug 12 '82 | 20.7 | -27.1% | 58.3% |
| Aug 25 '87 | Dec 4 '87 | 3.4 | -33.5% | 22.8% |
| Mar 24 '00 | Sep 21 '01 | 18.2 | -36.8% | -13.7% |
| Jan 4 '02 | Oct 9 '02 | 9.3 | -33.8% | 33.7% |
| Oct 9 '07 | Nov 20 '08 | 13.6 | -51.9% | 45.0% |
| Jan 6 '09 | Mar 9 '09 | 2.1 | -27.6% | 68.6% |
| Average | Row 14 - Cell 1 | 12 | -32.3% | 36.2% |
War
| Dow Jones Industrial Average (DJIA) | Header Cell - Column 1 | Header Cell - Column 2 | Header Cell - Column 3 | Header Cell - Column 4 |
|---|---|---|---|---|
| War | Begin | End | Total Months | Change in DJIA |
| World War l | Apr '17 | Nov '18 | 20 | -19% |
| World War ll | Dec '41 | Aug '45 | 45 | 41% |
| Korean War | Jun '50 | Jul '53 | 37 | 20% |
| Vietnam War | Aug '64 | Jan '73 | 102 | 21% |
| Gulf War | Jan '91 | Feb '91 | 2 | 15% |
| Iraq War | Mar '03 | Dec '11 | 105 | 43% |
| Average | Row 7 - Cell 1 | Row 7 - Cell 2 | 52 | 20% |
Terrorism on U.S. Soil
| S&P 500 Index | ||
|---|---|---|
| Attacks of September 11, 2001 | Days after Attack | Total Return S&P 500 |
| Initial Market Reaction September 17, 2001 | 7 | -4.9% |
| Market Bottom after Attack September 21, 2001 | 11 | -11.6% |
| One Month after Attack October 11, 2001 | 30 | 0.4% |
| Two Months after Attack November 10, 2001 | 60 | 2.5% |
| Three Months after Attack December 10, 2001 | 90 | 4.3% |
Despite all the recessions, wars, terrorist attacks and market crashes, the stock market has been an excellent investment over the long term. The key is to stay invested through thick and thin. When you invest in a portfolio of stocks and bonds, be aware of the potential upside and downside associated with your investments. If you don’t understand the risks at the outset, youare more likely to react poorly during periodic market setbacks and get scared out of the market.
At the outset when you buy an investment, you should plan on worst-case scenarios occurring at some point. If you understand the risk from the beginning, you are more likely to stay invested for the long term and realize solid long-term gains. It is true that past performance isn’t guaranteed to repeat, but it does give us a historical indication of what to expect.
Profit and prosper with the best of Kiplinger's advice on investing, taxes, retirement, personal finance and much more. Delivered daily. Enter your email in the box and click Sign Me Up.

Ray LeVitre is an independent fee-only Certified Financial Adviser with over 20 years of financial services experience. In addition he is the founder of Net Worth Advisory Group and the author of "20 Retirement Decisions You Need to Make Right Now."
-
 Ask the Tax Editor: Federal Income Tax Deductions
Ask the Editor In this week's Ask the Editor Q&A, Joy Taylor answers questions on federal income tax deductions
-
 States With No-Fault Car Insurance Laws (and How No-Fault Car Insurance Works)
A breakdown of the confusing rules around no-fault car insurance in every state where it exists.
-
 7 Frugal Habits to Keep Even When You're Rich
Some frugal habits are worth it, no matter what tax bracket you're in.
-
 For the 2% Club, the Guardrails Approach and the 4% Rule Do Not Work: Here's What Works Instead
For retirees with a pension, traditional withdrawal rules could be too restrictive. You need a tailored income plan that is much more flexible and realistic.
-
 Retiring Next Year? Now Is the Time to Start Designing What Your Retirement Will Look Like
This is when you should be shifting your focus from growing your portfolio to designing an income and tax strategy that aligns your resources with your purpose.
-
 I'm a Financial Planner: This Layered Approach for Your Retirement Money Can Help Lower Your Stress
To be confident about retirement, consider building a safety net by dividing assets into distinct layers and establishing a regular review process. Here's how.
-
 The 4 Estate Planning Documents Every High-Net-Worth Family Needs (Not Just a Will)
The key to successful estate planning for HNW families isn't just drafting these four documents, but ensuring they're current and immediately accessible.
-
 Love and Legacy: What Couples Rarely Talk About (But Should)
Couples who talk openly about finances, including estate planning, are more likely to head into retirement joyfully. How can you get the conversation going?
-
 How to Get the Fair Value for Your Shares When You Are in the Minority Vote on a Sale of Substantially All Corporate Assets
When a sale of substantially all corporate assets is approved by majority vote, shareholders on the losing side of the vote should understand their rights.
-
 How to Add a Pet Trust to Your Estate Plan: Don't Leave Your Best Friend to Chance
Adding a pet trust to your estate plan can ensure your pets are properly looked after when you're no longer able to care for them. This is how to go about it.
-
 Want to Avoid Leaving Chaos in Your Wake? Don't Leave Behind an Outdated Estate Plan
An outdated or incomplete estate plan could cause confusion for those handling your affairs at a difficult time. This guide highlights what to update and when.