The Magic of Moving Averages
This technical indicator can help predict where stocks are headed.

You are now subscribed
Your newsletter sign-up was successful
Want to add more newsletters?

Delivered daily
Kiplinger Today
Profit and prosper with the best of Kiplinger's advice on investing, taxes, retirement, personal finance and much more delivered daily. Smart money moves start here.

Sent five days a week
Kiplinger A Step Ahead
Get practical help to make better financial decisions in your everyday life, from spending to savings on top deals.

Delivered daily
Kiplinger Closing Bell
Get today's biggest financial and investing headlines delivered to your inbox every day the U.S. stock market is open.

Sent twice a week
Kiplinger Adviser Intel
Financial pros across the country share best practices and fresh tactics to preserve and grow your wealth.

Delivered weekly
Kiplinger Tax Tips
Trim your federal and state tax bills with practical tax-planning and tax-cutting strategies.

Sent twice a week
Kiplinger Retirement Tips
Your twice-a-week guide to planning and enjoying a financially secure and richly rewarding retirement

Sent bimonthly.
Kiplinger Adviser Angle
Insights for advisers, wealth managers and other financial professionals.

Sent twice a week
Kiplinger Investing Weekly
Your twice-a-week roundup of promising stocks, funds, companies and industries you should consider, ones you should avoid, and why.

Sent weekly for six weeks
Kiplinger Invest for Retirement
Your step-by-step six-part series on how to invest for retirement, from devising a successful strategy to exactly which investments to choose.
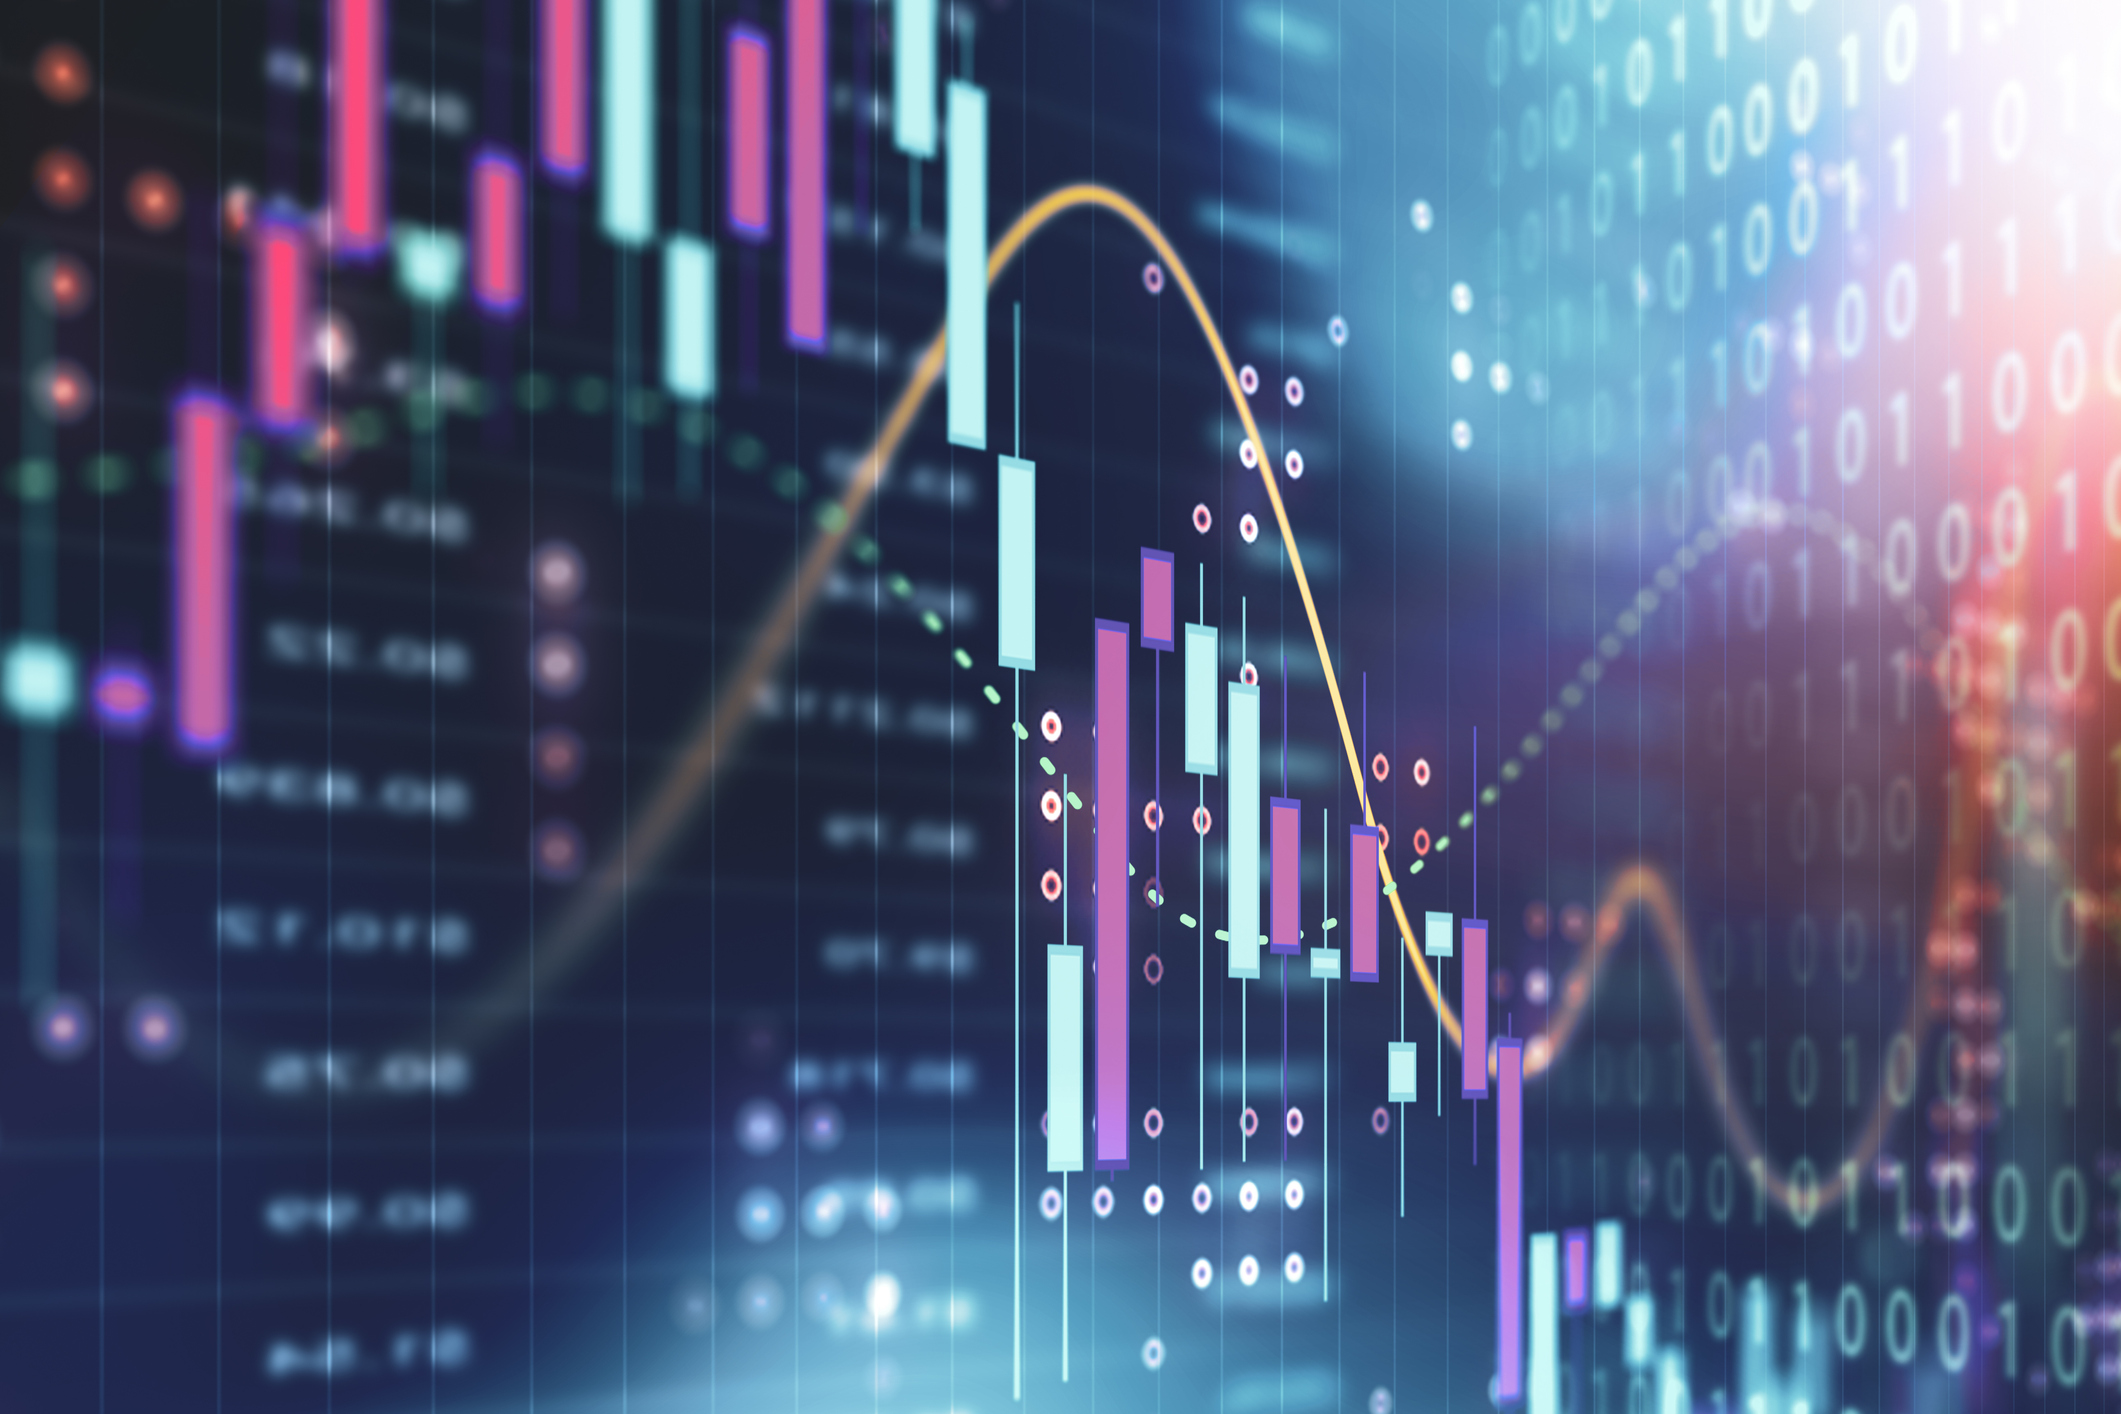
When price charts begin to look like jagged mountain ranges, it can be hard to map out which way stocks are headed. Enter the simple moving average. The tool is a staple of technical analysis—the practice of determining the direction of stock prices based on statistical patterns. It can sharpen the stock market picture, and, although a moving average won’t pinpoint peaks or troughs, it can tell you whether the momentum of a stock or an index is up or down.
A simple moving average is calculated by adding up a stock’s or an index’s daily closing prices over a given period—the most popular periods are 50 days and 200 days—and dividing by the number of days in that period. A moving average “effectively smooths out the noise of daily price swings, so that investors can see which way things are trending,” says William Delwiche, an investment analyst at financial services firm Baird. Moving averages can be superimposed on stock charts on nearly any brokerage website, as well as on free sites, such as Yahoo Finance.
Stock prices that diverge from the prevailing trend of a moving average can be a signal to buy or sell—or at least to become more bullish or bearish. When a stock’s price falls below its moving average, it’s considered a sign of a weakening trend and indicates heightened risk and uncertainty, says Mark Dodson, research director at investment management firm Cypress Capital. “Adopting a simple rule, such as not buying a stock until its price rises above its 50- or 200-day moving average, can help you avoid riding a company to the bottom,” he says.
From just $107.88 $24.99 for Kiplinger Personal Finance
Become a smarter, better informed investor. Subscribe from just $107.88 $24.99, plus get up to 4 Special Issues

Sign up for Kiplinger’s Free Newsletters
Profit and prosper with the best of expert advice on investing, taxes, retirement, personal finance and more - straight to your e-mail.
Profit and prosper with the best of expert advice - straight to your e-mail.

When a price rises above the moving average, investors should be more risk-tolerant and aggressive, Dodson adds. For example, Facebook’s 50-day moving average may be signaling better days ahead for the beleaguered social media stock. The stock has surrendered 18% since falling below its 50-day moving average last July, but it began trading above its average in early January. (Returns and other data in this story are through January 11.)
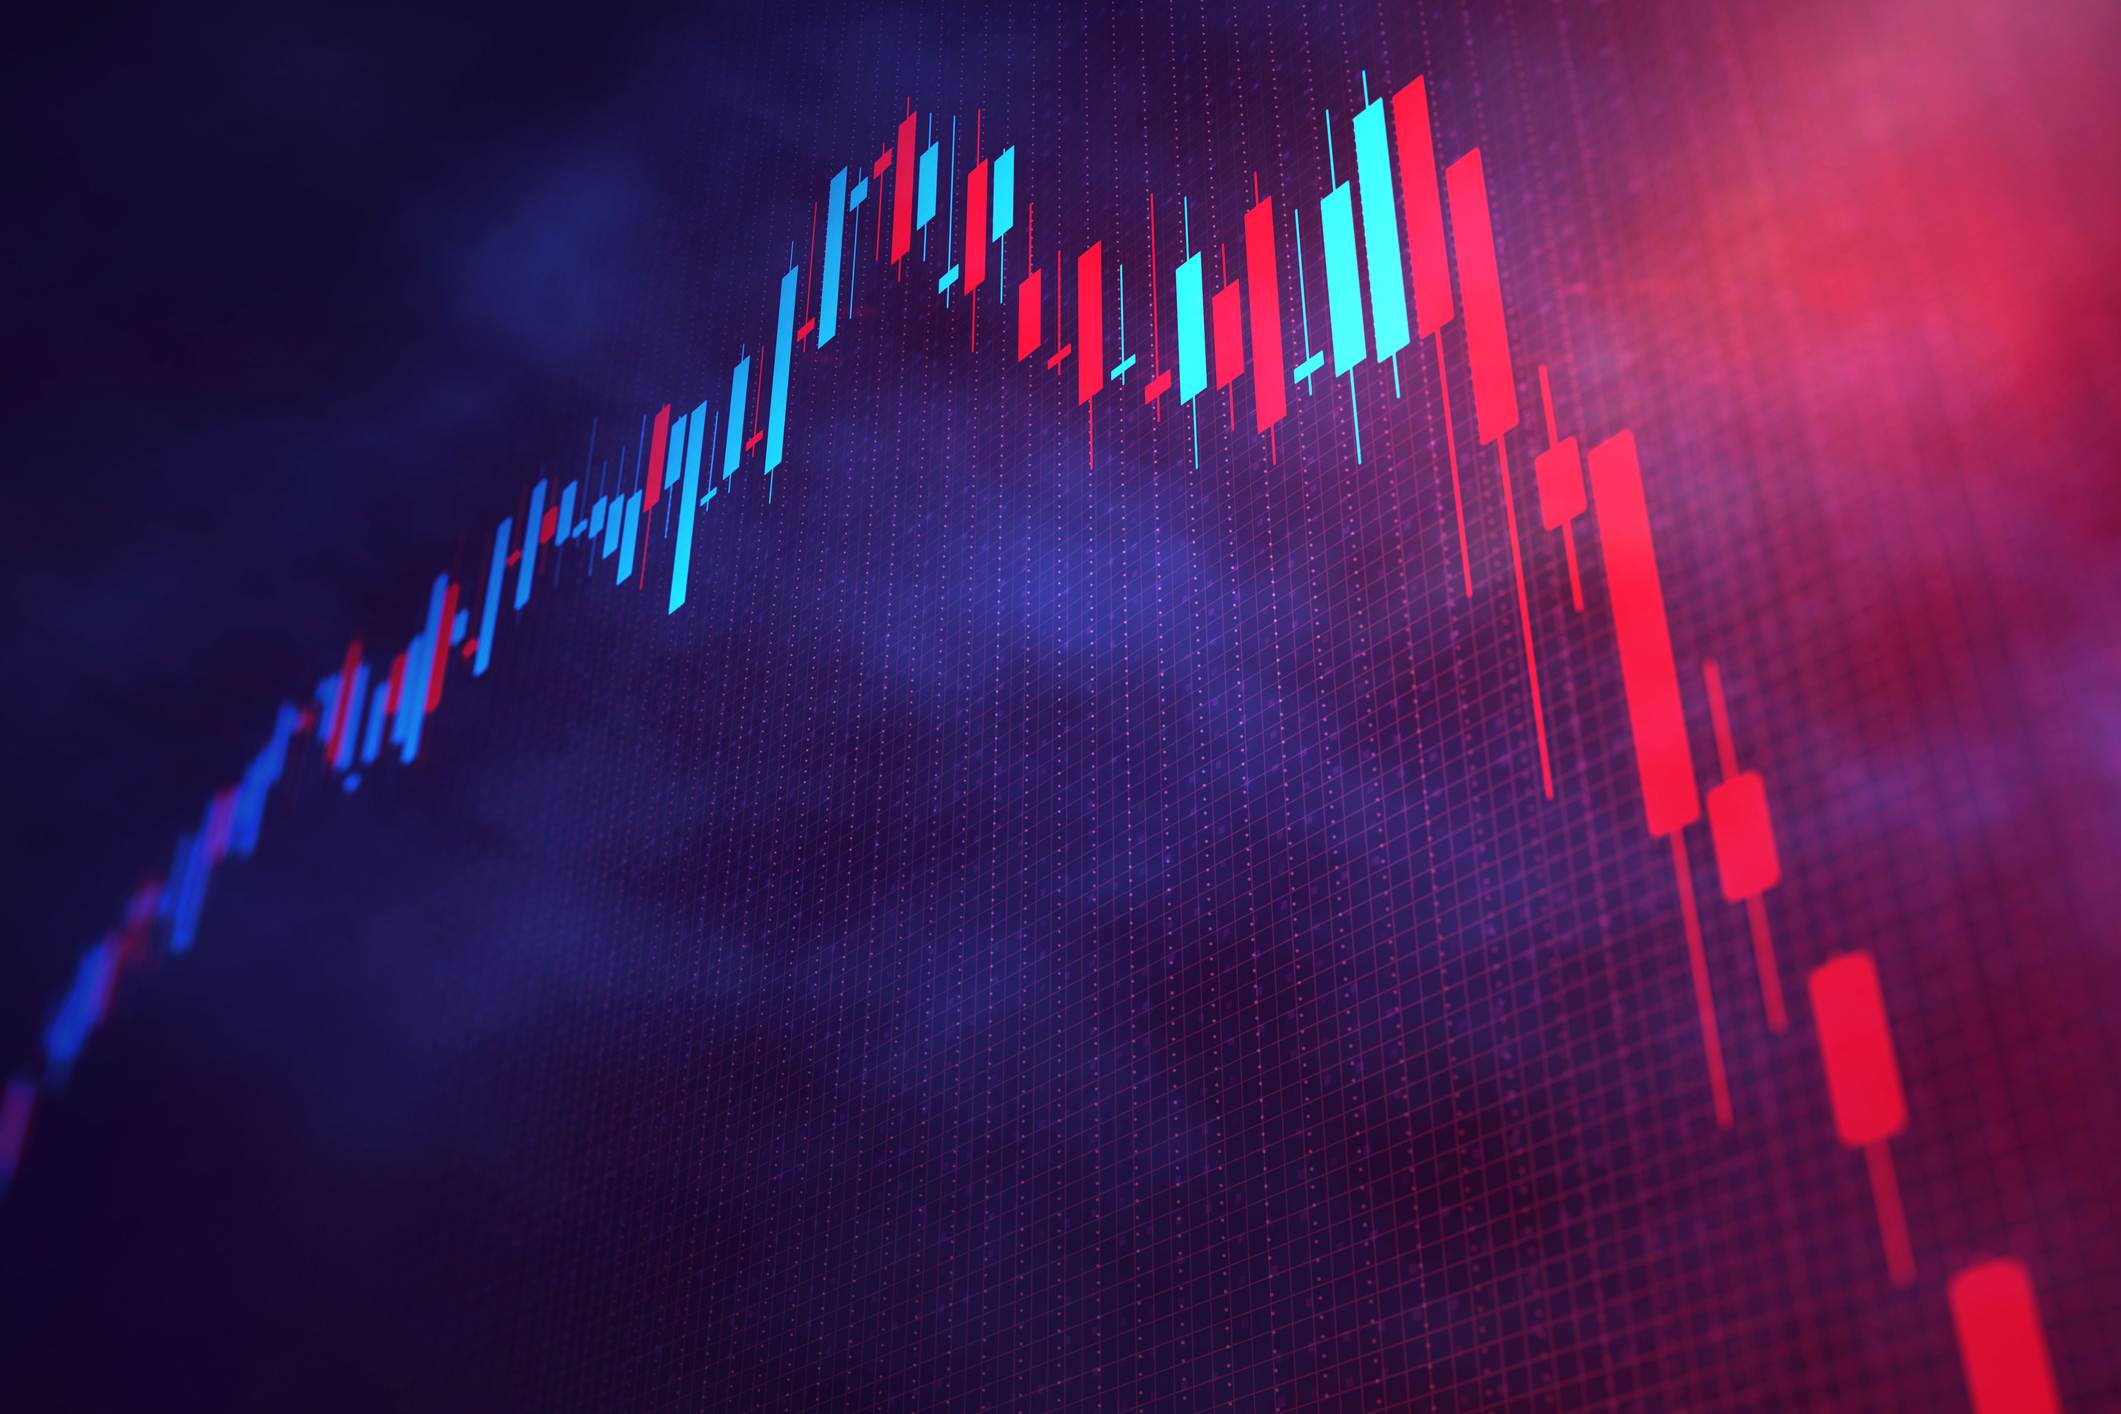
Crossed signals. More-advanced technical analysis focuses on the interaction between longer- and shorter-term moving averages. During a healthy bull market, for example, both the 50-day moving average and the 200-day moving average would be headed in the same direction, with the 50-day average higher than the 200-day indicator.
But when a 50-day moving average dips below an investment’s 200-day average, it results in a scary-sounding red flag: the “death cross.” That’s what happened with Standard & Poor’s 500-stock index in early December. The death cross is a “definite sell signal,” says Louise Yamada, author of the newsletter TechPoints, as it indicates that a short-term pullback may be devolving into a long-term downturn. The inverse, the “golden cross,” is considered a buy signal.
But the death cross is far from being a perfect indicator of prolonged market slides. Although the S&P 500 came perilously close to a bear market in late December, it has since turned around, so it remains to be seen whether the most recent instance was prescient or a false alarm. Though a cross in December 2007 presaged the worst of the ’07–’09 bear market, crosses in 2011 and 2015 signaled market slides that never became full-fledged bears.
For fundamentals-based investors—those who rely on data such as corporate earnings and economic growth—poring over stock charts can seem like reading tea leaves. But technical signals can be a valuable tool to get a sense of the market’s underlying trends, as long as investors understand that they’re only part of a larger toolbox, says Delwiche. “Don’t try to turn these signals into foolproof market-timing devices,” he says.

-
 Dow Adds 1,206 Points to Top 50,000: Stock Market Today
The S&P 500 and Nasdaq also had strong finishes to a volatile week, with beaten-down tech stocks outperforming.
-
 Ask the Tax Editor: Federal Income Tax Deductions
Ask the Editor In this week's Ask the Editor Q&A, Joy Taylor answers questions on federal income tax deductions
-
 States With No-Fault Car Insurance Laws (and How No-Fault Car Insurance Works)
A breakdown of the confusing rules around no-fault car insurance in every state where it exists.


-
Dow Adds 1,206 Points to Top 50,000: Stock Market Today
The S&P 500 and Nasdaq also had strong finishes to a volatile week, with beaten-down tech stocks outperforming.
-
 Stocks Sink With Alphabet, Bitcoin: Stock Market Today
A dismal round of jobs data did little to lift sentiment on Thursday.
-
 Dow Leads in Mixed Session on Amgen Earnings: Stock Market Today
The rest of Wall Street struggled as Advanced Micro Devices earnings caused a chip-stock sell-off.
-
 Nasdaq Slides 1.4% on Big Tech Questions: Stock Market Today
Palantir Technologies proves at least one publicly traded company can spend a lot of money on AI and make a lot of money on AI.
-
 Fed Vibes Lift Stocks, Dow Up 515 Points: Stock Market Today
Incoming economic data, including the January jobs report, has been delayed again by another federal government shutdown.
-
 Stocks Close Down as Gold, Silver Spiral: Stock Market Today
A "long-overdue correction" temporarily halted a massive rally in gold and silver, while the Dow took a hit from negative reactions to blue-chip earnings.
-
 If You'd Put $1,000 Into AMD Stock 20 Years Ago, Here's What You'd Have Today
Advanced Micro Devices stock is soaring thanks to AI, but as a buy-and-hold bet, it's been a market laggard.
-
 Nasdaq Drops 172 Points on MSFT AI Spend: Stock Market Today
Microsoft, Meta Platforms and a mid-cap energy stock have a lot to say about the state of the AI revolution today.


