Fewer Trades, More Gains
Trading generates taxes, and taxes, combined with trading costs, erode long-term returns.

Profit and prosper with the best of Kiplinger's advice on investing, taxes, retirement, personal finance and much more. Delivered daily. Enter your email in the box and click Sign Me Up.
You are now subscribed
Your newsletter sign-up was successful
Want to add more newsletters?

Delivered daily
Kiplinger Today
Profit and prosper with the best of Kiplinger's advice on investing, taxes, retirement, personal finance and much more delivered daily. Smart money moves start here.

Sent five days a week
Kiplinger A Step Ahead
Get practical help to make better financial decisions in your everyday life, from spending to savings on top deals.

Delivered daily
Kiplinger Closing Bell
Get today's biggest financial and investing headlines delivered to your inbox every day the U.S. stock market is open.

Sent twice a week
Kiplinger Adviser Intel
Financial pros across the country share best practices and fresh tactics to preserve and grow your wealth.

Delivered weekly
Kiplinger Tax Tips
Trim your federal and state tax bills with practical tax-planning and tax-cutting strategies.

Sent twice a week
Kiplinger Retirement Tips
Your twice-a-week guide to planning and enjoying a financially secure and richly rewarding retirement

Sent bimonthly.
Kiplinger Adviser Angle
Insights for advisers, wealth managers and other financial professionals.

Sent twice a week
Kiplinger Investing Weekly
Your twice-a-week roundup of promising stocks, funds, companies and industries you should consider, ones you should avoid, and why.

Sent weekly for six weeks
Kiplinger Invest for Retirement
Your step-by-step six-part series on how to invest for retirement, from devising a successful strategy to exactly which investments to choose.
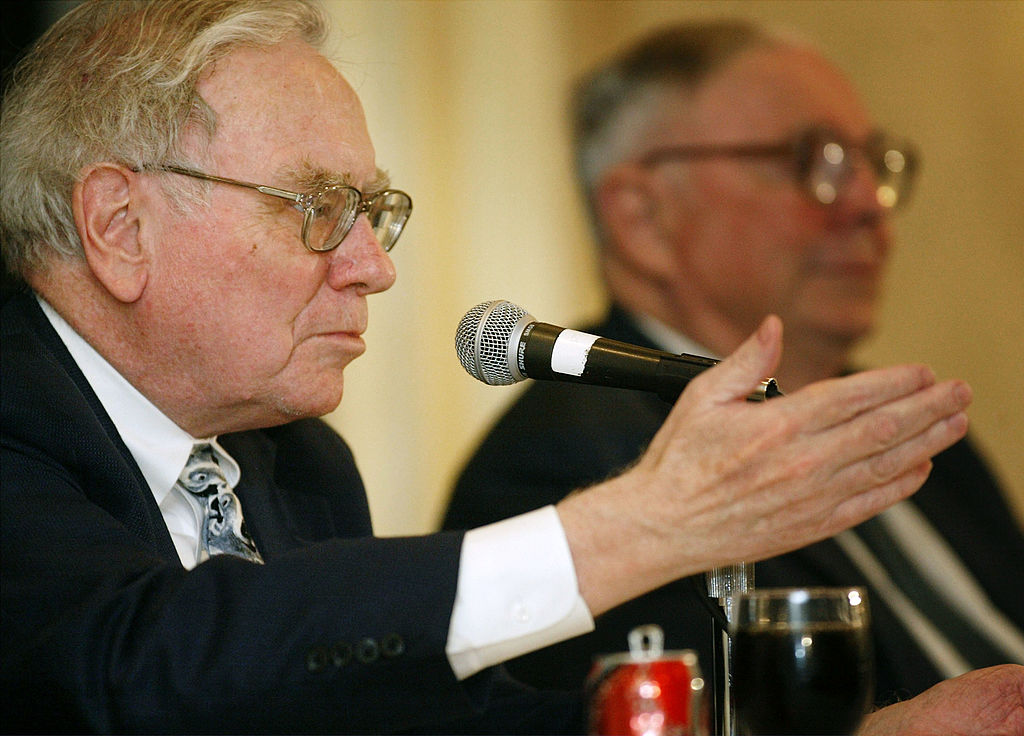
The economy may be anemic, but the stock market has been flush. Over the past year, Standard & Poor’s 500-stock index returned 27%, and since the middle of November, it has gone nearly straight up. I hate to be the one to tell you this, but bull markets aren’t forever. Investors earn their money not in good times but in bad — when they muster the courage to hang on. The alternative, broadly called “trading,” is bad for your investment health. As Warren Buffett, the CEO of Berkshire Hathaway, put it, “Much success can be attributed to inactivity.”
QUIZ: Are You a Trader or an Investor?
Inactivity works in part because no one really knows the best time to buy or sell. That’s because the market is efficient: Today’s prices are the sum of everything known and suspected by millions of investors about every stock. Tomorrow, the market will respond to new information, which, by definition, is unknowable today.
To make educated guesses about the long term, we can glean clues from history. We know, for example, that a diversified portfolio of U.S. stocks has returned about 10% annualized, or 7% after inflation, for nearly a century. We know that what goes up goes down, and vice versa, and that the overall trend is up. We know that trading stocks is a bad strategy. Fear and greed impel us to sell at the wrong times. Trading generates taxes, and taxes, combined with trading costs, erode long-term returns.
From just $107.88 $24.99 for Kiplinger Personal Finance
Become a smarter, better informed investor. Subscribe from just $107.88 $24.99, plus get up to 4 Special Issues

Sign up for Kiplinger’s Free Newsletters
Profit and prosper with the best of expert advice on investing, taxes, retirement, personal finance and more - straight to your e-mail.
Profit and prosper with the best of expert advice - straight to your e-mail.
In 2000, Brad Barber and Terrance Odean, professors at the University of California at Davis, published a groundbreaking study in the Journal of Finance titled, “Trading Is Hazardous to Your Wealth.” They received access to the records of more than 66,000 customers of a large discount brokerage. They found that people who traded the most averaged returns that were 30% lower than those of the average customer — and 36% lower than the stock market itself.
The cost of trading is one facet of investing that you can control. Those costs apply not just to individual stocks but to mutual funds. Fund managers are under pressure to trade to justify their often-exorbitant salaries. Fidelity Large Cap Growth (symbol FSLGX), for instance, has annual turnover of 151%, which suggests that the fund turns over its entire portfolio every eight months. And the typical fund that invests in large companies with a blend of growth and value attributes turns over its holdings at a rate of 70%, meaning that the average stock is held less than a year and a half.
Expense drag. Many investors assume that the main cost in owning a mutual fund is the expense ratio, which includes the cost of managing the portfolio; legal, accounting and printing expenses; and sometimes marketing costs. For U.S. stock funds, that fee averages 1.19% of a fund’s assets annually, according to a new study covering 1995 through 2006 by researchers Roger Edelen, Richard Evans and Gregory Kadlec.
Over time, these fees mount up. Consider the Fidelity fund mentioned above. Its expense ratio, at 0.90%, is below average. But if you invest $10,000 and the fund returns an annualized 10% over the next decade, you will pay $1,444 in expenses, or 10.6% of your profits, according to Fund Analyzer, an online tool provided at Finra.org. (Finra is the brokerage industry’s self-regulatory body.)
But Edelen and his colleagues also found that the costs of trading the securities in the average stock mutual fund (what they call “aggregate costs”) came to another 1.44%. These costs aren’t transparent. You don’t write a check for them each year, and they don’t appear on a line in a fund’s prospectus, as the expense ratio does; they show up only in a fund’s diminished return.
And that brings us to the essential question: Can funds generate returns that overcome those high costs? An expensive BMW performs better than a low-priced Honda, so shouldn’t a high-cost fund deliver better returns than a low-cost one, even after taking all expenses into account? With regard to total costs, the Edelen study confirms what other research has shown on the matter of expense ratios: The luxury brands turn out to be clunkers. “We found a strong negative relation,” says the study, “between aggregate trading cost and fund return performance.”
It’s a rare stock picker who consistently beats the market. So if nearly every fund manager generates gross returns that are close to the market averages, then the fund’s costs become the single most powerful determinant of its net returns — that is, of what you get to keep in your pocket.
[page break]
What are these “aggregate trading costs” anyway? They include brokerage commissions, the bid-ask spread (the difference between the price at which a stock trades and the actual price you get when buying or selling), and what Edelen and the others call price impact. Every time a large fund takes a position in a stock, it pushes up the stock price. The same is true with selling. When a fund puts shares on the market, it drives the price down.
It’s hard for an individual investor to calculate a fund’s aggregate trading costs, but the turnover rate, a figure that is reported annually by every fund (and can be found on Morningstar.com and other services), makes a good proxy. A fund that rarely buys and sells has low aggregate trading costs. Still, be aware that the trades of a fund that invests in stocks of small companies are likely to have a much greater impact on price than the actions of a fund that focuses on large companies (the difference between the waves generated by a splash in a kiddie pool and one in an Olympic pool).
I used Morningstar’s screening tool to find high-performing U.S. stock funds with low expense ratios. Here are some fine actively managed large- and mid-cap funds:
Yacktman Fund (YACKX), run by its eponymous manager, Donald Yacktman, for the past 21 years, gained 14.0% annualized over the past five years (returns are through May 31). The S&P 500, by contrast, returned 5.4% annualized. A longtime favorite of mine, Yacktman has an expense ratio of 0.76% (low for an actively managed fund), and its turnover is just 7% (meaning that the fund holds a stock for an average of 14 years!).
Nicholas Fund (NICSX), a mid-cap fund run by founder Albert Nicholas since 1969, carries an expense ratio of 0.75%, and its annual turnover is 25%. The fund returned 10.2% annualized over the past five years.
Primecap Odyssey Stock (POSKX), a large-cap fund that’s run by one of the nation’s best fund-management firms, returned an annualized 7.1% over the past five years, with less volatility than the market. Its expense ratio is 0.66%, and, despite a portfolio of more than 100 stocks, annual turnover is typically 10% or so.
Or consider two other low-turnover funds that have expense ratios of 0.8% or less and have whipped the S&P 500 over the past five years: Mairs & Power Growth (MPGFX), a member of the Kiplinger 25 with turnover of just 2%; and my old favorite, ING Corporate Leaders Trust (LEXCX), which essentially has a fixed portfolio and expenses of only 0.52% (see Opening Shot).
Buy and hold is the best advice I can give to someone who buys individual stocks. The same advice applies to fund investors as well. Find a buy-and-hold manager — or buy an index fund — and hang on for the long term. You won’t regret it.
James K. Glassman is executive director of the George W. Bush Institute, whose latest book on economic policy is titled The 4% Solution.
Profit and prosper with the best of Kiplinger's advice on investing, taxes, retirement, personal finance and much more. Delivered daily. Enter your email in the box and click Sign Me Up.

-
 How to Turn Your 401(k) Into A Real Estate Empire
Tapping your 401(k) to purchase investment properties is risky, but it could deliver valuable rental income in your golden years.
-
 My First $1 Million: Retired Nuclear Plant Supervisor, 68
Ever wonder how someone who's made a million dollars or more did it? Kiplinger's My First $1 Million series uncovers the answers.
-
 How to Position Investments to Minimize Taxes for Your Heirs
To minimize your heirs' tax burden, focus on aligning your investment account types and assets with your estate plan, and pay attention to the impact of RMDs.
-
 Best Mutual Funds to Invest In for 2026
The best mutual funds will capitalize on new trends expected to emerge in the new year, all while offering low costs and solid management.
-
 Why I Trust These Trillion-Dollar Stocks
The top-heavy nature of the S&P 500 should make any investor nervous, but there's still plenty to like in these trillion-dollar stocks.
-
 What Made Warren Buffett's Career So Remarkable
What made the ‘Oracle of Omaha’ great, and who could be next as king or queen of investing?
-
 With Buffett Retiring, Should You Invest in a Berkshire Copycat?
Warren Buffett will step down at the end of this year. Should you explore one of a handful of Berkshire Hathaway clones or copycat funds?
-
 Stocks at New Highs as Shutdown Drags On: Stock Market Today
The Nasdaq Composite, S&P 500 and Dow Jones Industrial Average all notched new record closes Thursday as tech stocks gained.
-
 9 Warren Buffett Quotes for Investors to Live By
Warren Buffett transformed Berkshire Hathaway from a struggling textile firm to a sprawling conglomerate and investment vehicle. Here's how he did it.
-
 A Timeline of Warren Buffett's Life and Berkshire Hathaway
Buffett was the face of Berkshire Hathaway for 60 years. Here's a timeline of how he built the sprawling holding company and its outperforming equity portfolio.
-
 Berkshire Buys the Dip on UnitedHealth Group Stock. Should You?
Buffett & Co. picked up UnitedHealth stock on the cheap, with the embattled blue chip one of the newest holdings in the Berkshire Hathaway equity portfolio.