Super Bowl LX: Should Investors Root for the Seahawks or the Patriots?
The Super Bowl Indicator suggests investors should have a palpable interest in Sunday's game between the Seattle Seahawks and the New England Patriots.

Karee Venema
Profit and prosper with the best of Kiplinger's advice on investing, taxes, retirement, personal finance and much more. Delivered daily. Enter your email in the box and click Sign Me Up.
You are now subscribed
Your newsletter sign-up was successful
Want to add more newsletters?

Delivered daily
Kiplinger Today
Profit and prosper with the best of Kiplinger's advice on investing, taxes, retirement, personal finance and much more delivered daily. Smart money moves start here.

Sent five days a week
Kiplinger A Step Ahead
Get practical help to make better financial decisions in your everyday life, from spending to savings on top deals.

Delivered daily
Kiplinger Closing Bell
Get today's biggest financial and investing headlines delivered to your inbox every day the U.S. stock market is open.

Sent twice a week
Kiplinger Adviser Intel
Financial pros across the country share best practices and fresh tactics to preserve and grow your wealth.

Delivered weekly
Kiplinger Tax Tips
Trim your federal and state tax bills with practical tax-planning and tax-cutting strategies.

Sent twice a week
Kiplinger Retirement Tips
Your twice-a-week guide to planning and enjoying a financially secure and richly rewarding retirement

Sent bimonthly.
Kiplinger Adviser Angle
Insights for advisers, wealth managers and other financial professionals.

Sent twice a week
Kiplinger Investing Weekly
Your twice-a-week roundup of promising stocks, funds, companies and industries you should consider, ones you should avoid, and why.

Sent weekly for six weeks
Kiplinger Invest for Retirement
Your step-by-step six-part series on how to invest for retirement, from devising a successful strategy to exactly which investments to choose.

If you think investors shouldn't have a rooting interest in Sunday's big game, the Super Bowl Indicator might just change your mind.
Experts, amateurs and idiot savants alike have forever gone to great lengths to divine the direction of share prices. Just as the ancients studied the entrails of sheep, today's would-be market prognosticators have looked for auguries in shades of lipstick, the production of cardboard boxes, aspirin prices, the lengths of women's skirts and the cover of the Sports Illustrated Swimsuit Issue.
All of those subjects and more have been measured, analyzed and tracked to determine the market's future direction. And in a scant couple of days, we shall receive yet another mystical portent for the future path of the S&P 500:
From just $107.88 $24.99 for Kiplinger Personal Finance
Become a smarter, better informed investor. Subscribe from just $107.88 $24.99, plus get up to 4 Special Issues

Sign up for Kiplinger’s Free Newsletters
Profit and prosper with the best of expert advice on investing, taxes, retirement, personal finance and more - straight to your e-mail.
Profit and prosper with the best of expert advice - straight to your e-mail.
The great and mighty Super Bowl Indicator.
First coined in 1978 by New York Times sportswriter Leonard Koppett, the Super Bowl Indicator goes like this: If an original National Football League (now the National Football Conference or NFC) team wins the Super Bowl, stocks should rise for the rest of the year. But if the Super Bowl winner is an original American Football League (now the American Football Conference or AFC) team, stocks should fall.
Briefly put, that means as long as you have more of a rooting interest in your 401(k) or IRA than you do either of Sunday's competitors, you should be pulling for the NFC's Seattle Seahawks over the AFC's New England Patriots.
However, going by more recent results, investors might want to cheer a little less for Starbucks (SBUX) and a lot more for TJX (TJX).
Super Bowl Indicator: By the numbers
Before we dive any deeper, we'll quickly remind anyone who needs reminding that the Super Bowl has absolutely no effect on the stock market. None whatsoever.
But then, what is life without a little nonsense?
Again, the Super Bowl Indicator originally postulated that stocks will rise for the full year if an NFC team wins the "big game," and fall if the AFC wins. Up until 1978, when Koppett introduced the supposed market signal, it had a completely accurate track record. (With a big fat asterisk in that the Pittsburgh Steelers, an AFC team, were counted as an NFC team because the franchise's origins were in the original NFL.)
Since then, the Super Bowl Indicator hasn't been quite as laser-precise, but generally it has maintained its NFC-good, AFC-bad trend.
According to Ryan Detrick, chief market strategist at Carson Group and lifelong Cincinnati Bengals fan, the S&P 500 has averaged a 10.2% gain since 1967 in years the NFC has won the Super Bowl, beating the 8.1% average gain in years the AFC has won.
Most recently, the Super Bowl Indicator prevailed in 2025 when the Philadelphia Eagles beat the Kansas City Chiefs and the S&P 500 ended the year up 17.9% on a total return (price change plus dividends) basis.
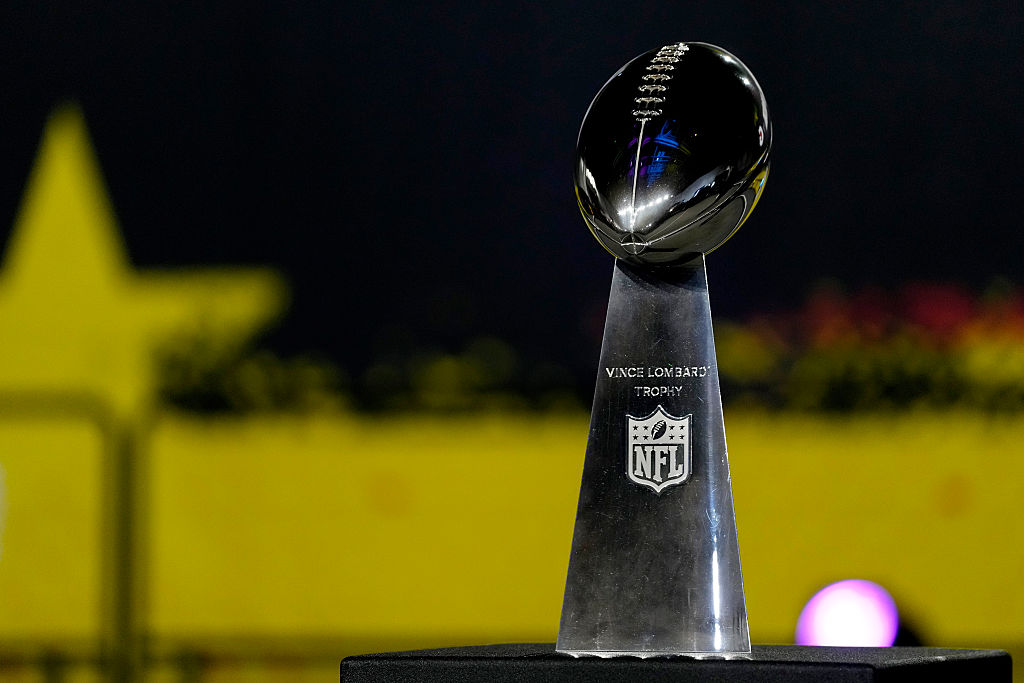
However, the S&P 500 produced a 25% annual gain in 2024, even though the AFC's Kansas City Chiefs took home the Vince Lombardi Trophy instead of the San Francisco 49ers.
In fact, recent history favors the American Football Conference.
From 2004 to 2024, stocks gained over the full year 11 times when a team from the AFC won the championship, says Detrick. "In fact, the only time stocks were lower was in 2015, when the full year ended down -0.7%, so virtually flat," he adds.
Indeed, the average S&P 500 return across those 12 AFC wins is 15%.
Curiously, the lone negative year came when Tom Brady won his fourth Super Bowl with the Patriots … two weeks after the "Deflategate" scandal. Feel free to blame that blip on some underinflated footballs, too.
Other Super Bowl and stock market stats
Although it's no more applicable than the Super Bowl Indicator, data from S&P Global Market Intelligence offers a broader list of stock-market performance breakdowns based on Super Bowl winners is every bit as entertaining.
For instance, the higher the points scored in a game, the better for the stock market. "When the teams in the Super Bowl combine to score at least 46 points, the stock market returns 16.3% on average," says S&P Global. "If the final combined score is under 46, the average market return is just 7.2%."
But bulls might want to be worried about the location of this year's big game. Not only does the stock market do worse when the Super Bowl is held west of the Mississippi River (8.6% vs 14.3% when it occurs on the east side).
However, they can find some respite knowing that the game will be played in an open-air stadium. This is because the S&P 500 tends to outperform when the Super Bowl is played in an open-air stadium or one where the retractable roof is open vs when it's played in a dome or the retractable roof is closed.
Related content
- Did You Bet on the Super Bowl? Don't Forget the Taxes
- Here's How to Stream the Super Bowl for Less
- How Much It Costs to Host a Super Bowl Party in 2026
Profit and prosper with the best of Kiplinger's advice on investing, taxes, retirement, personal finance and much more. Delivered daily. Enter your email in the box and click Sign Me Up.
Kyle Woodley is the Editor-in-Chief of WealthUp, a site dedicated to improving the personal finances and financial literacy of people of all ages. He also writes the weekly The Weekend Tea newsletter, which covers both news and analysis about spending, saving, investing, the economy and more.
Kyle was previously the Senior Investing Editor for Kiplinger.com, and the Managing Editor for InvestorPlace.com before that. His work has appeared in several outlets, including Yahoo! Finance, MSN Money, Barchart, The Globe & Mail and the Nasdaq. He also has appeared as a guest on Fox Business Network and Money Radio, among other shows and podcasts, and he has been quoted in several outlets, including MarketWatch, Vice and Univision. He is a proud graduate of The Ohio State University, where he earned a BA in journalism.
You can check out his thoughts on the markets (and more) at @KyleWoodley.
- Karee VenemaSenior Investing Editor, Kiplinger.com
-
 5 Vince Lombardi Quotes Retirees Should Live By
The iconic football coach's philosophy can help retirees win at the game of life.
-
 The $200,000 Olympic 'Pension' is a Retirement Game-Changer for Team USA
The donation by financier Ross Stevens is meant to be a "retirement program" for Team USA Olympic and Paralympic athletes.
-
 10 Cheapest Places to Live in Colorado
Property Tax Looking for a cozy cabin near the slopes? These Colorado counties combine reasonable house prices with the state's lowest property tax bills.
-
 Don't Bury Your Kids in Taxes: How to Position Your Investments to Help Create More Wealth for Them
To minimize your heirs' tax burden, focus on aligning your investment account types and assets with your estate plan, and pay attention to the impact of RMDs.
-
 Are You 'Too Old' to Benefit From an Annuity?
Probably not, even if you're in your 70s or 80s, but it depends on your circumstances and the kind of annuity you're considering.
-
 In Your 50s and Seeing Retirement in the Distance? What You Do Now Can Make a Significant Impact
This is the perfect time to assess whether your retirement planning is on track and determine what steps you need to take if it's not.
-
 Your Retirement Isn't Set in Stone, But It Can Be a Work of Art
Setting and forgetting your retirement plan will make it hard to cope with life's challenges. Instead, consider redrawing and refining your plan as you go.
-
 The Bear Market Protocol: 3 Strategies to Consider in a Down Market
The Bear Market Protocol: 3 Strategies for a Down Market From buying the dip to strategic Roth conversions, there are several ways to use a bear market to your advantage — once you get over the fear factor.
-
 Dow Adds 1,206 Points to Top 50,000: Stock Market Today
The S&P 500 and Nasdaq also had strong finishes to a volatile week, with beaten-down tech stocks outperforming.
-
 The Best Precious Metals ETFs to Buy in 2026
Precious metals ETFs provide a hedge against monetary debasement and exposure to industrial-related tailwinds from emerging markets.
-
 For the 2% Club, the Guardrails Approach and the 4% Rule Do Not Work: Here's What Works Instead
For retirees with a pension, traditional withdrawal rules could be too restrictive. You need a tailored income plan that is much more flexible and realistic.
