Why Inverted Yield Curve Panic Is Overdone
Yes, a 10-and-2 yield curve inversion has predicted many past recessions. But it's an imprecise signal – and one that leads equity investors astray.

Profit and prosper with the best of Kiplinger's advice on investing, taxes, retirement, personal finance and much more. Delivered daily. Enter your email in the box and click Sign Me Up.
You are now subscribed
Your newsletter sign-up was successful
Want to add more newsletters?

Delivered daily
Kiplinger Today
Profit and prosper with the best of Kiplinger's advice on investing, taxes, retirement, personal finance and much more delivered daily. Smart money moves start here.

Sent five days a week
Kiplinger A Step Ahead
Get practical help to make better financial decisions in your everyday life, from spending to savings on top deals.

Delivered daily
Kiplinger Closing Bell
Get today's biggest financial and investing headlines delivered to your inbox every day the U.S. stock market is open.

Sent twice a week
Kiplinger Adviser Intel
Financial pros across the country share best practices and fresh tactics to preserve and grow your wealth.

Delivered weekly
Kiplinger Tax Tips
Trim your federal and state tax bills with practical tax-planning and tax-cutting strategies.

Sent twice a week
Kiplinger Retirement Tips
Your twice-a-week guide to planning and enjoying a financially secure and richly rewarding retirement

Sent bimonthly.
Kiplinger Adviser Angle
Insights for advisers, wealth managers and other financial professionals.

Sent twice a week
Kiplinger Investing Weekly
Your twice-a-week roundup of promising stocks, funds, companies and industries you should consider, ones you should avoid, and why.

Sent weekly for six weeks
Kiplinger Invest for Retirement
Your step-by-step six-part series on how to invest for retirement, from devising a successful strategy to exactly which investments to choose.
In case you haven't heard by now, the "10-and-2" yield curve momentarily inverted this week. Some market participants and financial media have responded with alarm, and given this signal's singular track record of predicting U.S. recessions, that's not exactly the wrong reaction.
But it's not necessarily helpful, either.
Although an inverted yield curve is as reliable an indicator of looming economic downturn as we have, no one data point is ever infallible. It's also the case that inverted yield curves are wildly imprecise at forecasting the onset of recession.
From just $107.88 $24.99 for Kiplinger Personal Finance
Become a smarter, better informed investor. Subscribe from just $107.88 $24.99, plus get up to 4 Special Issues

Sign up for Kiplinger’s Free Newsletters
Profit and prosper with the best of expert advice on investing, taxes, retirement, personal finance and more - straight to your e-mail.
Profit and prosper with the best of expert advice - straight to your e-mail.
Further complicating matters is that while the four most dangerous words in investing are "this time it's different," some experts argue that this time, it really is different.
Either way, what investors most need to know is that an inverted yield curve is by no means a portent of impending doom – not for the economy, and not for the stock market, either.
What Is an Inverted Yield Curve?
The yield curve is a visual representation of bond yields across maturities. Longer-dated bonds typically pay higher interest rates to compensate investors for the increased risk they assume over time. The longer a bondholder has to wait to recoup his or her principal, the greater the chance inflation will erode the purchasing power of the investment, or the borrower will default, or some other bad thing will happen.
Bonds with shorter maturities, then, are supposed to yield less than bonds with longer maturities. But sometimes that relationship gets out of whack.
As you can see in the chart below, the yield curve is pretty steep up until it hits the two-year maturity mark, but then it flattens out. That's not right.
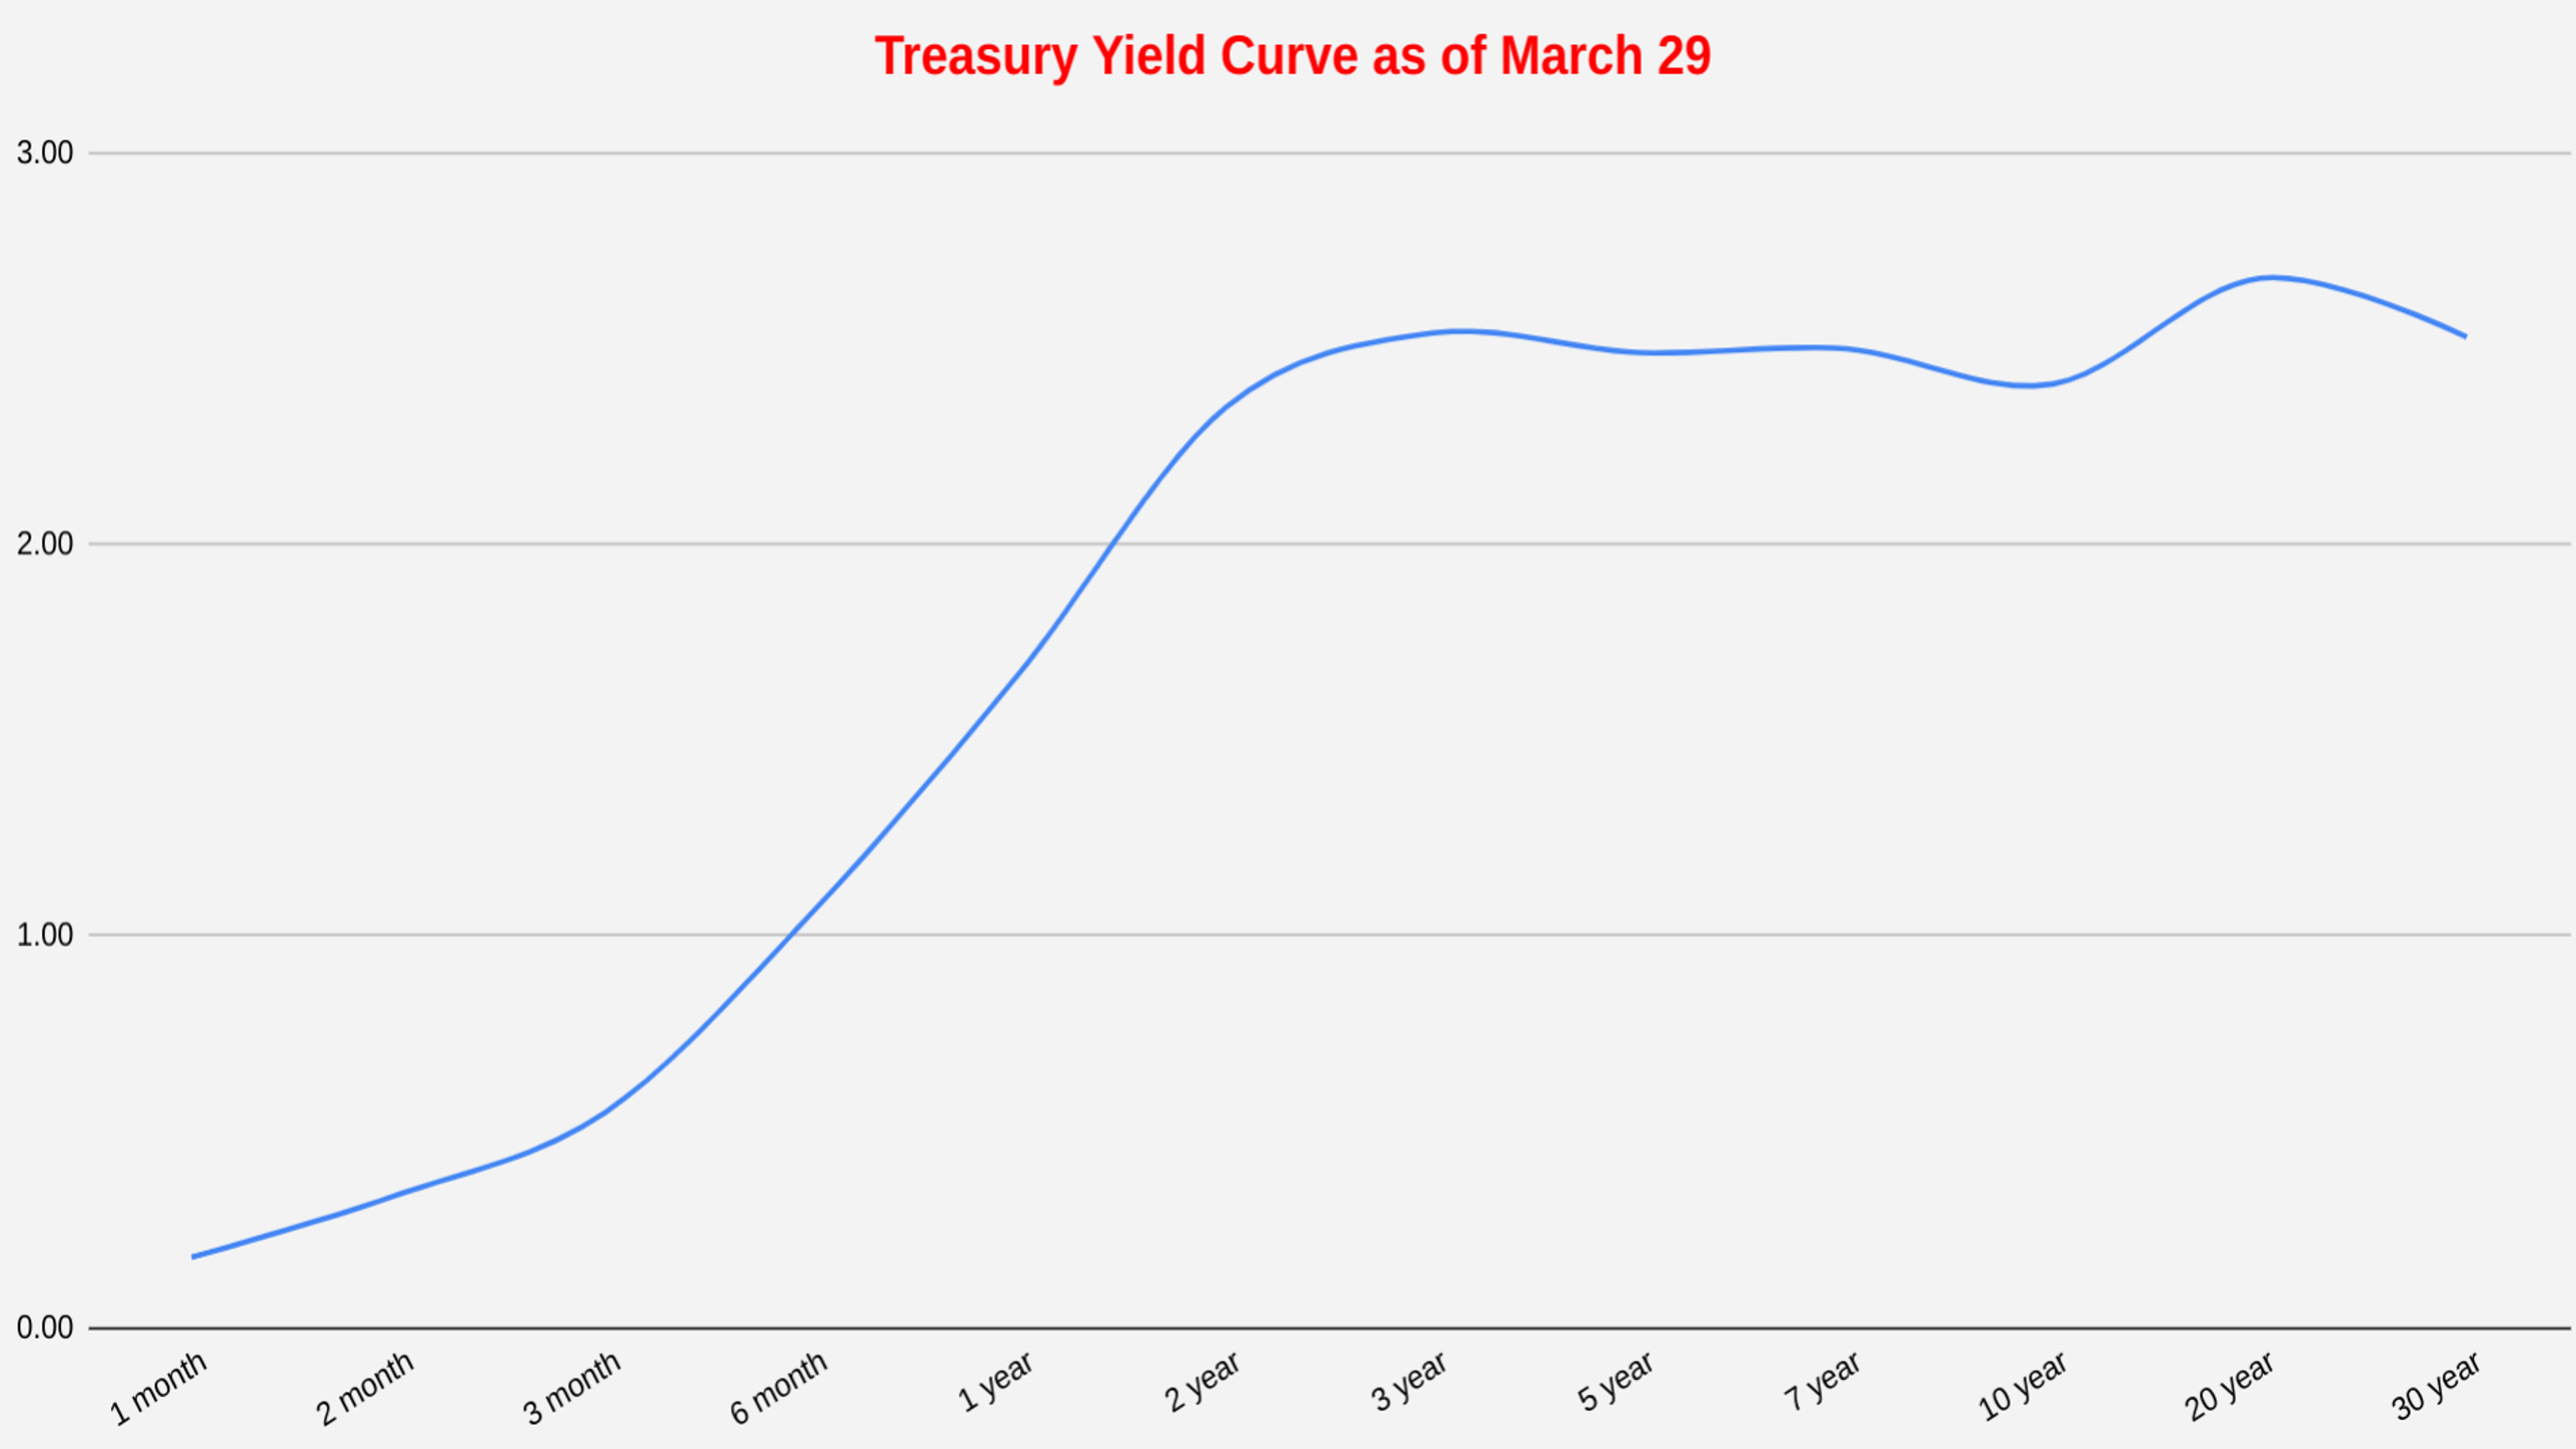
Investors, strategists and economists watch several different yield curves, but the 10-and-2 yield curve – or spread between the yield on the 10-year Treasury note and the yield on the two-year Treasury note – has been the best predictor of past recessions. Anu Gaggar, global investment strategist for Commonwealth Financial Network, says that the 10-and-2 yield curve has inverted 28 times since 1900, and in 22 of those instances, a recession has followed.
This is the same curve that some (but not all) data providers said briefly inverted Tuesday and touched off this new round of hand-wringing.
"Yield curve flattening and, ultimately, inversion are features of an economy that is shifting gears from midcycle to late cycle," Gaggar writes. "In the late cycle, markets begin to fret that tighter monetary policy could take the wind out of the economy and a downturn might be approaching."
Have a look at the chart below, which shows the 10-year Treasury yield minus the two-year Treasury yield going back 50 years. Whenever the sum has gone negative, a recession (the shaded gray areas) has ensued:
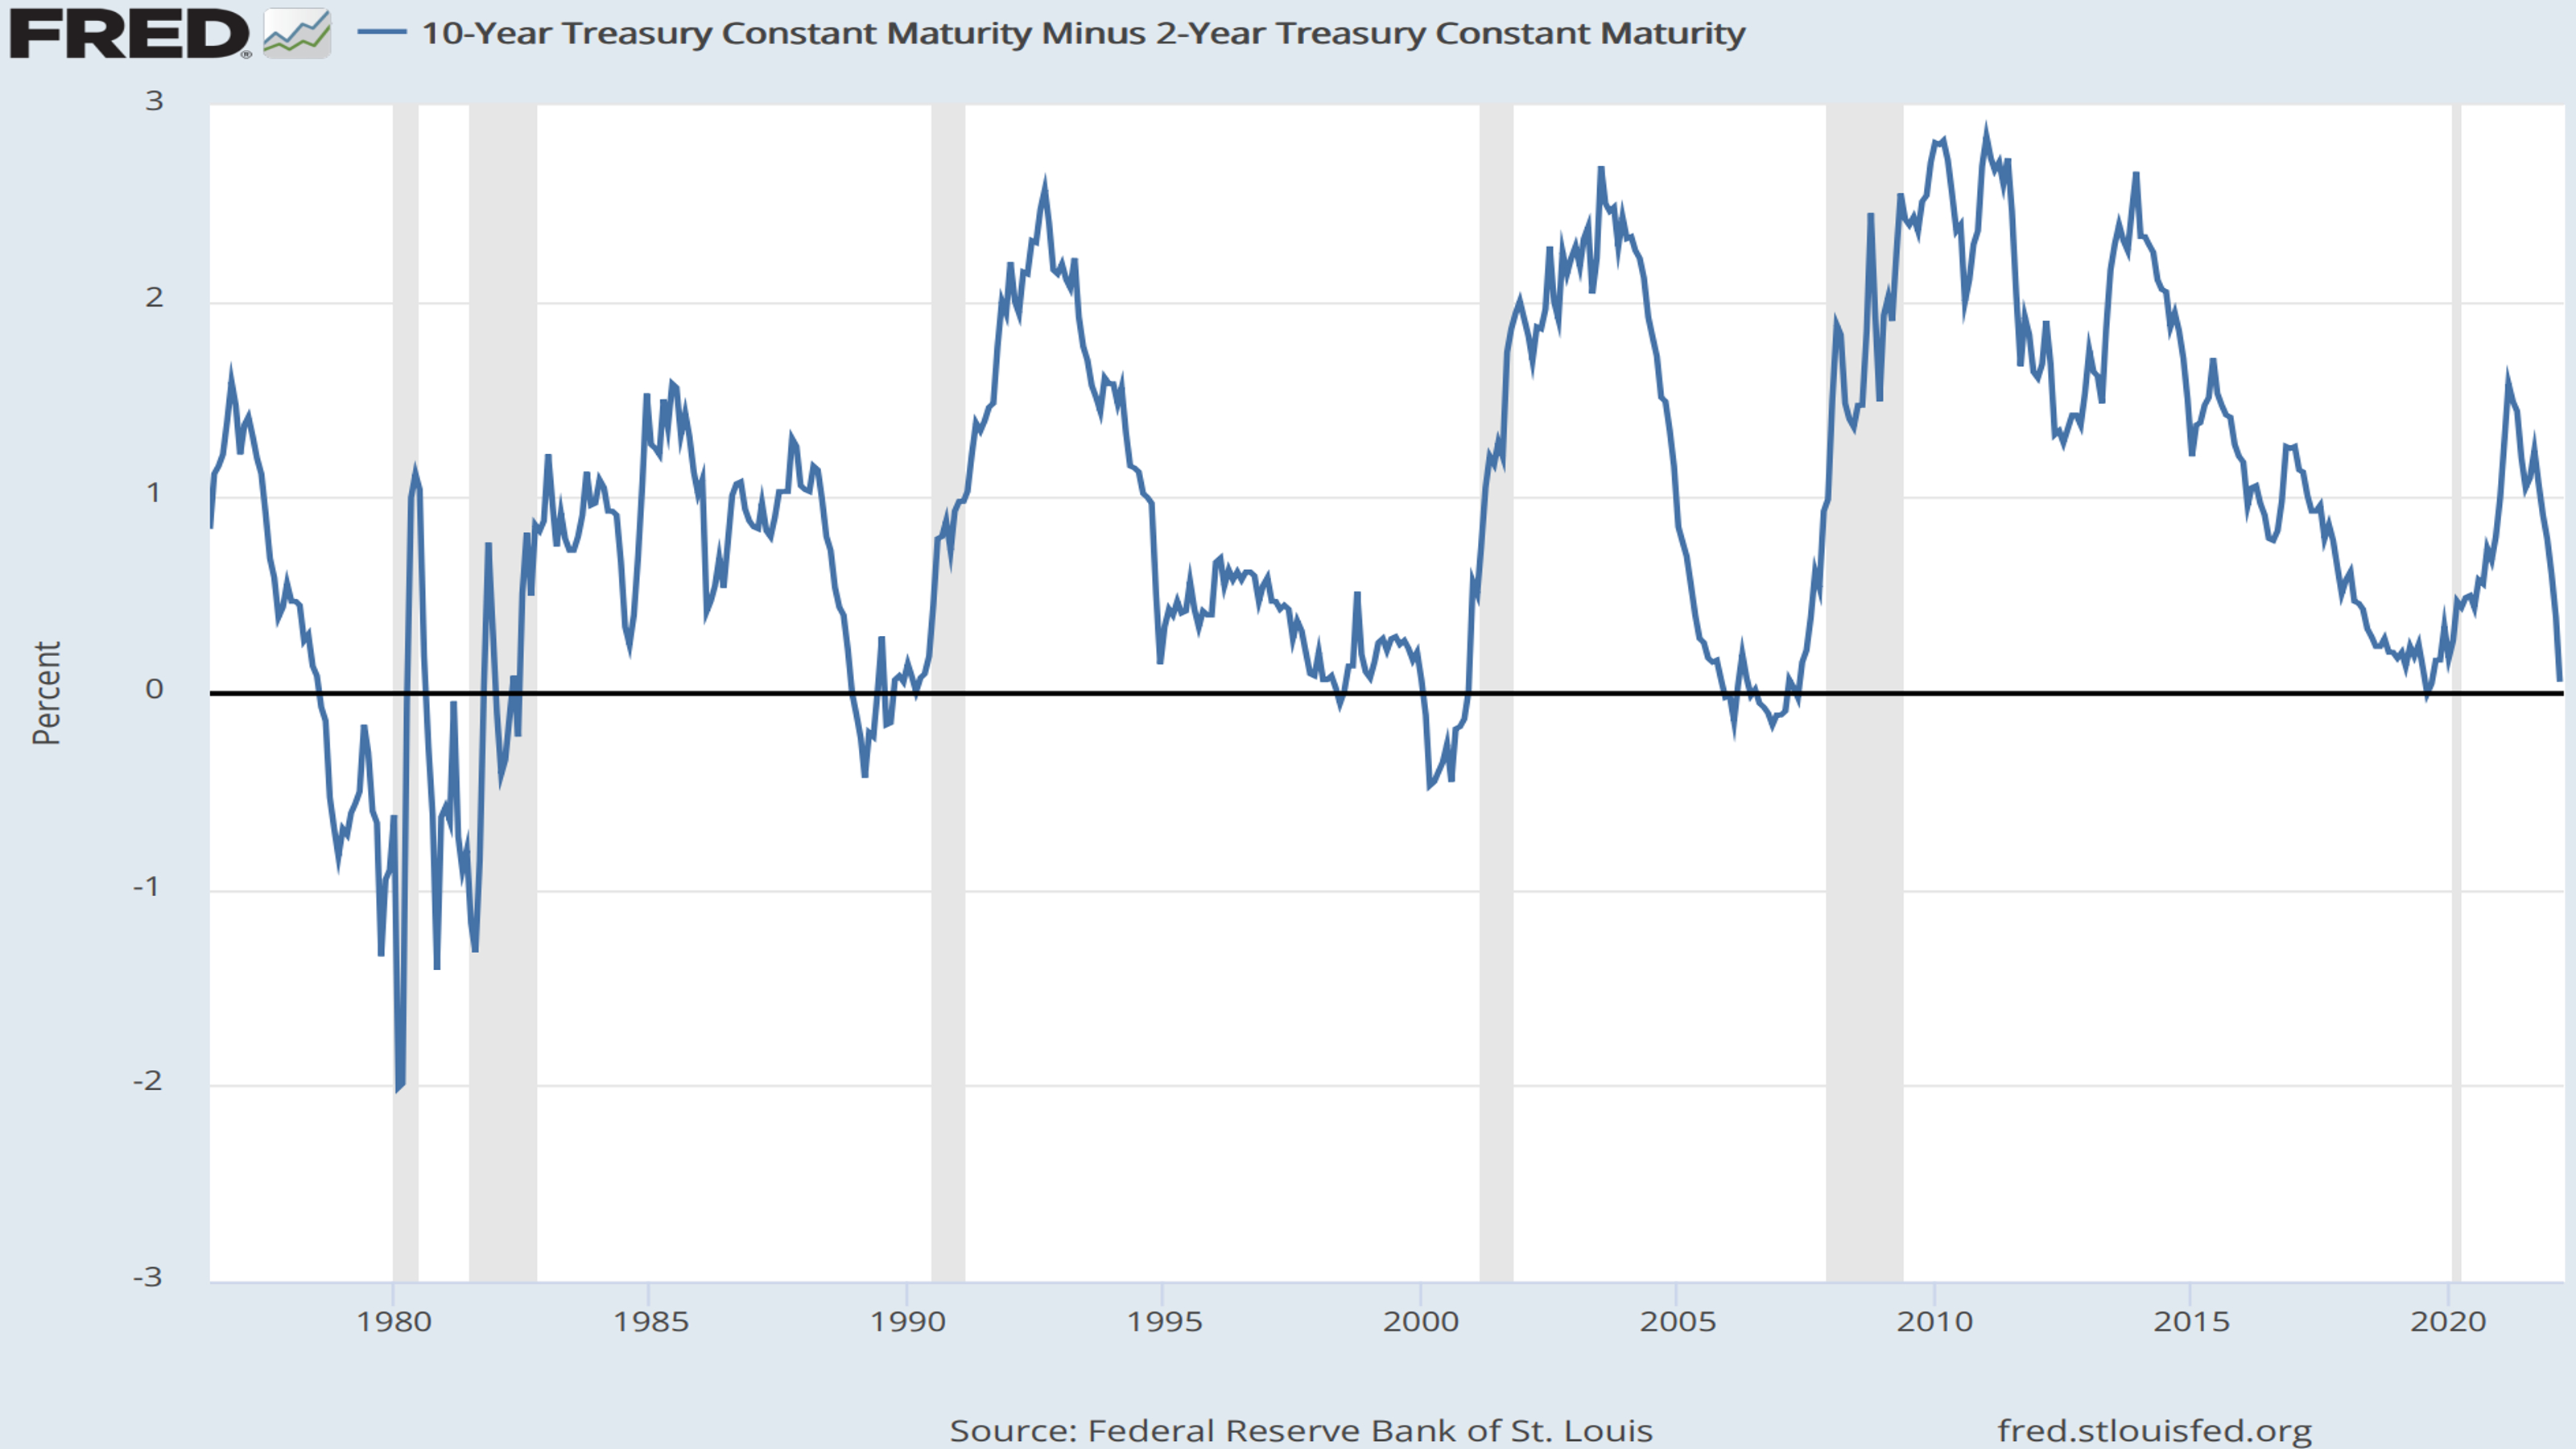
Note well that although an inverted yield curve might tell you a recession is coming, it won't tell you when.
You Can't Exactly Set Your Watch by Inversions
Going back to 1900, the lag between a yield curve inversion and the start of a recession has averaged about 22 months, Gaggar says.
Over the past six recessions, however, that lag has ranged from as little as six months to as long as three years.
The U.S. economy averages one recession every five years. Thus, an inverted yield curve that takes three years to forecast recession isn't that different from a stopped clock that's right twice a day.
Looked at another way, over the past six decades, the median time between the initial inversion of the yield curve and the onset of a recession is 18 months, writes Brian Levitt, global market strategist at Invesco. Here are just a couple examples of the curve being less than helpful as a leading indicator:
- When the yield curve inverted in 1965, the following recession didn't hit until 1969, or 48 months later.
- The recession sparked by the busting of the tech bubble started in March 2001. But the yield curve inverted 34 months earlier, in May 1998.
Is It Different This Time?
The Federal Reserve's unprecedented intervention in bond markets has artificially depressed the 10-year Treasury yield, the thinking goes. Therefore, this instance of an inverted yield curve doesn't really count.
"Don't fear yield curve inversion," writes Ethan Harris, head of global economics research at BofA Securities. "It is not the standalone indicator of recessions as it once was."
True, historically, yield curve inversion has been the "most reliable" single indicator of U.S. recession risk, Harris and his team say. Today, however, the signal is "heavily distorted by the Fed's massive balance sheet and extremely low bond yields overseas."
Dr. Ed Yardeni, president of Yardeni Research, likewise sees the Fed's multiyear bond-buying spree as skewing the inversion data.
"Our models show the flatness of the curve could be more a consequence of the Fed's relentless buying of bonds, and the consequent growth of their balance sheet, rather than because of a looming growth shock," Yardeni writes.
Furthermore, if recession really is over the horizon, it's more likely to happen next year than in 2022, notes BCA Research.
"Although we expect economic growth to slow this year, we do not anticipate it will turn negative," says a BCA team. "Our expectation is that several of the current headwinds to growth – price pressures, the war in Ukraine, and the pandemic situation – will improve in the second half of the year."
Stocks Actually Do Quite Well After Inversions
The worst thing investors can do in pretty much any market scenario is panic. That goes double for when the yield curve inverts. Historically, the market actually does well between the first instance of an inverted yield curve and the market top that precedes any recession-induced drawdown in equites.
"The last four times the 2-and-10 yield curve inverted, the S&P 500 was up an average of 28.8% before it peaked," writes Ryan Detrick, chief market strategist at LPL Financial.
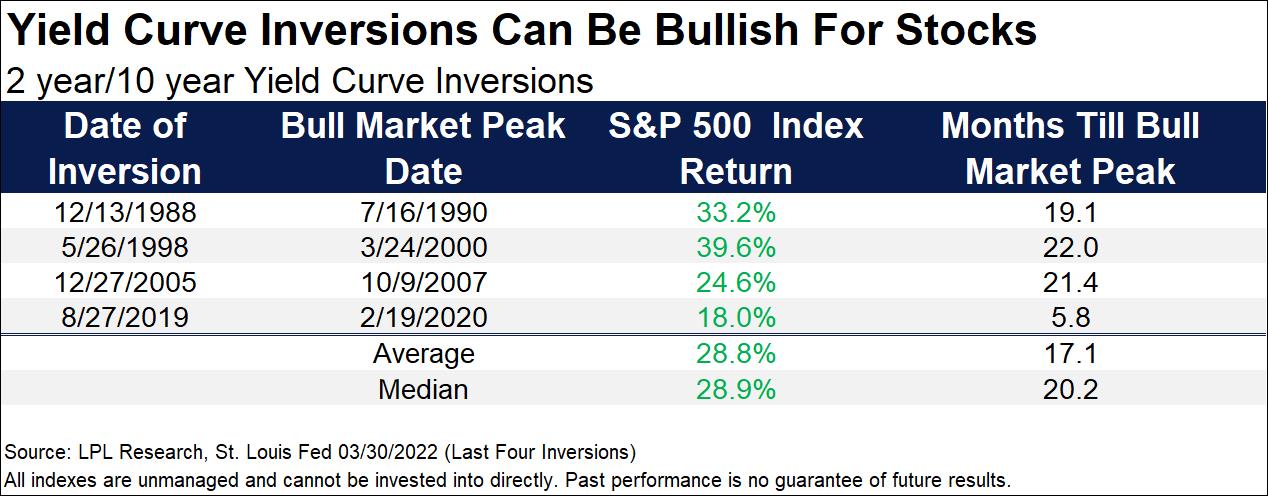
The S&P 500 hit its ultimate peak an average of 17.1 months after the inversion, Detrick adds, while recession started, on average, 21 months later.
Invesco's Levitt hammers home the same point.
"Equity investors should be mindful to not overreact when the yield curve first inverts," the strategist says. "An inverted yield curve has not been a very good timing tool for equity investors."
Indeed, by Levitt's reckoning, investors who sold when the yield curve first inverted on Dec. 14, 1988 missed a subsequent 34% gain in the S&P 500.
"Those who sold when it happened again on May 26, 1998, missed out on 39% additional upside to the market," he adds. "In fact, the median return of the S&P 500 Index from the date in each cycle when the yield curve inverts to the market peak is 19%."
The bottom line? Dumping equities because the yield curve inverted has proven to be a very poor investing strategy for a very long time.
Profit and prosper with the best of Kiplinger's advice on investing, taxes, retirement, personal finance and much more. Delivered daily. Enter your email in the box and click Sign Me Up.

Dan Burrows is Kiplinger's senior investing writer, having joined the publication full time in 2016.
A long-time financial journalist, Dan is a veteran of MarketWatch, CBS MoneyWatch, SmartMoney, InvestorPlace, DailyFinance and other tier 1 national publications. He has written for The Wall Street Journal, Bloomberg and Consumer Reports and his stories have appeared in the New York Daily News, the San Jose Mercury News and Investor's Business Daily, among many other outlets. As a senior writer at AOL's DailyFinance, Dan reported market news from the floor of the New York Stock Exchange.
Once upon a time – before his days as a financial reporter and assistant financial editor at legendary fashion trade paper Women's Wear Daily – Dan worked for Spy magazine, scribbled away at Time Inc. and contributed to Maxim magazine back when lad mags were a thing. He's also written for Esquire magazine's Dubious Achievements Awards.
In his current role at Kiplinger, Dan writes about markets and macroeconomics.
Dan holds a bachelor's degree from Oberlin College and a master's degree from Columbia University.
Disclosure: Dan does not trade individual stocks or securities. He is eternally long the U.S equity market, primarily through tax-advantaged accounts.
-
 How Much It Costs to Host a Super Bowl Party in 2026
Hosting a Super Bowl party in 2026 could cost you. Here's a breakdown of food, drink and entertainment costs — plus ways to save.
-
 3 Reasons to Use a 5-Year CD As You Approach Retirement
A five-year CD can help you reach other milestones as you approach retirement.
-
 Your Adult Kids Are Doing Fine. Is It Time To Spend Some of Their Inheritance?
If your kids are successful, do they need an inheritance? Ask yourself these four questions before passing down another dollar.
-
 If You'd Put $1,000 Into AMD Stock 20 Years Ago, Here's What You'd Have Today
Advanced Micro Devices stock is soaring thanks to AI, but as a buy-and-hold bet, it's been a market laggard.
-
 If You'd Put $1,000 Into UPS Stock 20 Years Ago, Here's What You'd Have Today
United Parcel Service stock has been a massive long-term laggard.
-
 If You'd Put $1,000 Into Lowe's Stock 20 Years Ago, Here's What You'd Have Today
Lowe's stock has delivered disappointing returns recently, but it's been a great holding for truly patient investors.
-
 If You'd Put $1,000 Into 3M Stock 20 Years Ago, Here's What You'd Have Today
MMM stock has been a pit of despair for truly long-term shareholders.
-
 If You'd Put $1,000 Into Coca-Cola Stock 20 Years Ago, Here's What You'd Have Today
Even with its reliable dividend growth and generous stock buybacks, Coca-Cola has underperformed the broad market in the long term.
-
 If You Put $1,000 into Qualcomm Stock 20 Years Ago, Here's What You Would Have Today
Qualcomm stock has been a big disappointment for truly long-term investors.
-
 If You'd Put $1,000 Into Home Depot Stock 20 Years Ago, Here's What You'd Have Today
Home Depot stock has been a buy-and-hold banger for truly long-term investors.
-
 If You'd Put $1,000 Into Bank of America Stock 20 Years Ago, Here's What You'd Have Today
Bank of America stock has been a massive buy-and-hold bust.