The Best Value Stocks to Buy
Value stocks can be defined differently depending on who you ask. Here, we look at ways to measure valuation and how investors can find the best value stocks.

Profit and prosper with the best of Kiplinger's advice on investing, taxes, retirement, personal finance and much more. Delivered daily. Enter your email in the box and click Sign Me Up.
You are now subscribed
Your newsletter sign-up was successful
Want to add more newsletters?

Delivered daily
Kiplinger Today
Profit and prosper with the best of Kiplinger's advice on investing, taxes, retirement, personal finance and much more delivered daily. Smart money moves start here.

Sent five days a week
Kiplinger A Step Ahead
Get practical help to make better financial decisions in your everyday life, from spending to savings on top deals.

Delivered daily
Kiplinger Closing Bell
Get today's biggest financial and investing headlines delivered to your inbox every day the U.S. stock market is open.

Sent twice a week
Kiplinger Adviser Intel
Financial pros across the country share best practices and fresh tactics to preserve and grow your wealth.

Delivered weekly
Kiplinger Tax Tips
Trim your federal and state tax bills with practical tax-planning and tax-cutting strategies.

Sent twice a week
Kiplinger Retirement Tips
Your twice-a-week guide to planning and enjoying a financially secure and richly rewarding retirement

Sent bimonthly.
Kiplinger Adviser Angle
Insights for advisers, wealth managers and other financial professionals.

Sent twice a week
Kiplinger Investing Weekly
Your twice-a-week roundup of promising stocks, funds, companies and industries you should consider, ones you should avoid, and why.

Sent weekly for six weeks
Kiplinger Invest for Retirement
Your step-by-step six-part series on how to invest for retirement, from devising a successful strategy to exactly which investments to choose.

Finding the best value stocks is similar to finding bargains at the grocery store or getting a sweet deal on the car.
However, with value stocks, the benefit of a discount isn't dollars in your pocket now – it's dollars in your pocket later, once the market realizes the stock's true value and drives the price higher.
That's how they're supposed to work, anyway.
From just $107.88 $24.99 for Kiplinger Personal Finance
Become a smarter, better informed investor. Subscribe from just $107.88 $24.99, plus get up to 4 Special Issues

Sign up for Kiplinger’s Free Newsletters
Profit and prosper with the best of expert advice on investing, taxes, retirement, personal finance and more - straight to your e-mail.
Profit and prosper with the best of expert advice - straight to your e-mail.
Today, we'll explore the concept of value investing, including how it's defined, why investors are drawn to it, ways in which stocks are valued, and how to find the best value stocks to buy.
Ticker | Company | Analysts' consensus recommendation | Forward P/E | PEG ratio | Dividend yield |
DELL | Dell Technologies | 1.80 | 10.0 | 0.671 | 1.8% |
CVS | CVS Health | 1.59 | 11.1 | 0.728 | 3.5 |
BAC | Bank of America | 1.62 | 12.7 | 0.99 | 2.0 |
CTRA | Coterra Energy | 1.70 | 14.9 | 0.63 | 2.9 |
CI | Cigna | 1.56 | 9.4 | 0.952 | 2.1 |
C | Citigroup | 1.74 | 11.3 | 0.509 | 2.1 |
FITB | Fifth Third Bancorp | 1.76 | 13.5 | 0.869 | 3.0 |
HBAN | Huntington Bancshares | 1.68 | 11.5 | 0.776 | 3.3 |
CFG | Citizens Financial Group | 1.52 | 13.0 | 0.539 | 2.8 |
SW | Smurfit Westrock | 1.33 | 17.0 | 0.516 | 4.2 |
MET | MetLife | 1.88 | 7.7 | 0.746 | 3.0 |
SYF | Synchrony Financial | 1.83 | 8.0 | 0.91 | 1.6 |
Ticker | Company | Analysts' consensus recommendation | Forward P/E | PEG ratio |
NCLH | Norwegian Cruise Line Holdings | 1.88 | 8.6 | 0.505 |
NRG | NRG Energy | 1.79 | 15.9 | 0.967 |
FSLR | First Solar | 1.78 | 10.7 | 0.34 |
ZBRA | Zebra Technologies | 1.78 | 14.0 | 0.708 |
WDAY | Workday | 1.77 | 15.6 | 0.552 |
NEM | Newmont | 1.71 | 12.0 | 0.204 |
NUE | Nucor | 1.67 | 15.4 | 0.877 |
CPAY | Corpay | 1.67 | 13.5 | 0.973 |
SNDK | Sandisk | 1.67 | 8.1 | 0.037 |
COF | Capital One Financial | 1.65 | 10.6 | 0.764 |
CRM | Salesforce | 1.64 | 15.0 | 0.89 |
MU | Micron Technology | 1.56 | 9.8 | 0.191 |
EQT | EQT | 1.56 | 14.3 | 0.714 |
KKR | KKR & Co. | 1.50 | 16.8 | 0.775 |
STLD | Steel Dynamics | 1.46 | 13.9 | 0.745 |
VST | Vistra | 1.43 | 13.6 | 0.605 |
UAL | United Airlines Holdings | 1.35 | 8.0 | 0.477 |
DAL | Delta Air Lines | 1.31 | 9.7 | 0.631 |
What are value stocks?
Value stocks are shares that trade for a lower price than what an investor thinks they should based on the company's underlying fundamentals.
And that's the only real simplicity you'll get with them.
That's largely because of the next natural question: How exactly do you measure a stock's value?
There's no single answer to this question, nor even just a few answers. Financial minds have wizarded up literally dozens of metrics that can be used to determine a stock's value, and thus determine whether a stock is under-, fairly or overly valued.
However, virtually all valuation metrics have some sort of blind spot, and some are really only useful in measuring certain categories of equities.
So it's typically best to use several metrics in concert when trying to identify value stocks.
Here are some of the most common valuation metrics:
Price-to-earnings (P/E):
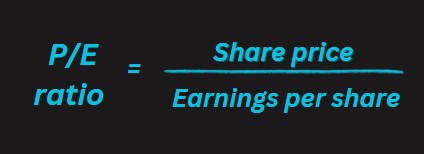
The price-to-earnings ratio – often referred to as P/E ratio – is calculated by dividing a stock's price per share by a 12-month period of earnings per share.
Typically, when someone simply says "P/E," they're referring to "trailing P/E," which uses the trailing 12 months' worth (aka the past four quarters' worth) of earnings. P/E is a quick-and-easy way to produce a value for a company based on hard, reported data that every company provides.
But it has a few issues. For one, the market is forward-looking, so valuing a stock based on what it has already done vs what it will do isn't necessarily useful.
Also, it can't be used to value companies that are not currently profitable.
And like many valuation metrics, P/E isn't useful on its own – you'll typically want to compare it to a company's peers, its industry and/or a benchmark index like the S&P 500.
Forward P/E:
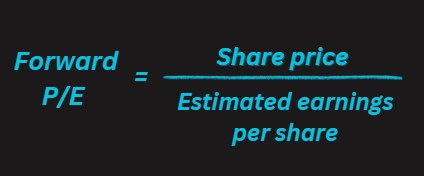
Forward P/E is similar to trailing P/E, except it uses earnings estimates for the E in the equation. On the one hand, you're dealing not with hard data, but merely analyst expectations.
On the other hand, instead of looking at what a company has already done, you're looking at what it might do in the future, which is more in line with where Wall Street's gaze is typically affixed.
Also, analyst expectations tend to be accurate enough to make forward P/E useful. Again, forward P/E on its own isn't too helpful; instead, you'll want to compare it to peers or the broader market.
Price/earnings-to-growth (PEG):
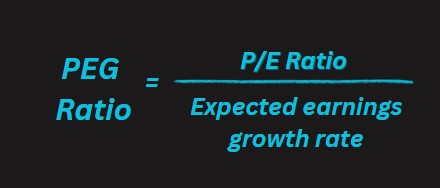
There is no perfect valuation metric, but PEG is one of the best. PEG takes a company's P/E (typically over the trailing 12 months), then divides that by its expected earnings growth rate, usually for the next five years.
The resulting number is evaluated through a system in which 1.0 is considered fairly valued, anything under 1.0 is considered undervalued and anything over 1.0 is considered overvalued.
PEG is a pretty useful metric because it factors in growth – based on, say, forward P/E, a utility stock might look much cheaper than a tech stock.
But once you also consider the expected growth you're buying, that utility stock might be expensive, and that tech stock might be a bargain.
You can use PEG on its own, but you can compare it to other PEGs. But like trailing and forward P/E, this doesn't work with companies that have no earnings.
Why do investors buy value stocks?
This question has a straightforward answer, at least.
Investors buy a value stock because they hope that, over time, other investors will begin to see the stock's intrinsic worth and buy up the stock, driving up the share price.
Also, like with any other classification of stock, investors also want the company's fundamentals to improve, further enticing investors to buy up shares.
We'll also note that, while it's hardly a rule, investing for value and investing for dividends frequently go hand in hand.
Growth stocks, which tend to be more expensive, frequently reinvest most if not all of their profits back into the business.
But slower-growth companies – the ones that tend to trade more in value territory – often use at least some of their cash to reward shareholders in the form of dividends.
How to find the best value stocks to buy
As mentioned above, there are a variety of metrics you can use to find under-loved stocks. As you become more familiar with these statistics, we urge you to incorporate them in your own research.
But if you're looking for the best value stocks to buy today, we've put together a basic quality screen to help you start your search:
To get to our lists of the best value stocks to buy, we looked for companies:
Within the S&P 500: To be clear: Value stocks exist in all shapes and sizes.
But to start with, we'll look for underappreciated names in the S&P 500, which is made up of predominantly large-cap stocks and a small contingent of mid-cap stocks.
With a forward P/E of less than 17.0: At the very least, we want to find the best stocks to buy that are cheaper than the market.
Currently, the S&P 500 is trading at 22.1 times forward earnings estimates, so we need stocks trading at a P/E of less than that.
With a PEG of less than 1: Where we'll really separate our stocks from the S&P 500 is PEG, which incorporates growth estimates.
The S&P 500 currently trades at a PEG of 1.18, which implies the broader market is overpriced.
Our screen will only include stocks with a PEG of 1 or less, which means they're not only quite a bit cheaper than the broader market, but also inexpensive by the technical definition of PEG.
With at least 10 covering analysts: We'd like to look at stocks that are on Wall Street analysts' radar, which makes it likelier that there's both more reporting and more insights on these companies.
The more stock research we have at our disposal, the more educated a decision we can make. Of course, because these are S&P 500 components, virtually all of them have a gaggle of analysts keeping tabs on them.
With a high-conviction consensus Buy rating: All of the stocks must have an average broker recommendation of 1.8 or less within S&P Global Market Intelligence's ratings scale.
S&P Global Market Intelligence converts analysts ratings into a numerical scale. Anything with a score of 2.5 or less is considered a Buy, while anything with a score of 1.5 or less is a Strong Buy – the highest designation.
By setting our bar at 1.9, we're ensuring all stocks included in the list are solidly in Buy territory at a bare minimum.
With a dividend yield of at least 1.5%: Again, because value investing and dividend investing often go hand in hand, we'll incorporate dividends into our screen.
We've set a yield bar of 1.6%, meaning all the stocks here offer at least a little bit more income than the S&P 500.
However, we recognize you might be dividend-agnostic.
So after the first group of stocks, you'll notice there's a second group of stocks produced by a screen that uses the same criteria above, but does not have a minimum yield (and in fact doesn't require the stocks to pay a dividend at all).
Related content
Profit and prosper with the best of Kiplinger's advice on investing, taxes, retirement, personal finance and much more. Delivered daily. Enter your email in the box and click Sign Me Up.
Kyle Woodley is the Editor-in-Chief of WealthUp, a site dedicated to improving the personal finances and financial literacy of people of all ages. He also writes the weekly The Weekend Tea newsletter, which covers both news and analysis about spending, saving, investing, the economy and more.
Kyle was previously the Senior Investing Editor for Kiplinger.com, and the Managing Editor for InvestorPlace.com before that. His work has appeared in several outlets, including Yahoo! Finance, MSN Money, Barchart, The Globe & Mail and the Nasdaq. He also has appeared as a guest on Fox Business Network and Money Radio, among other shows and podcasts, and he has been quoted in several outlets, including MarketWatch, Vice and Univision. He is a proud graduate of The Ohio State University, where he earned a BA in journalism.
You can check out his thoughts on the markets (and more) at @KyleWoodley.
-
 Ask the Tax Editor: Federal Income Tax Deductions
Ask the Editor In this week's Ask the Editor Q&A, Joy Taylor answers questions on federal income tax deductions
-
 States With No-Fault Car Insurance Laws (and How No-Fault Car Insurance Works)
A breakdown of the confusing rules around no-fault car insurance in every state where it exists.
-
 7 Frugal Habits to Keep Even When You're Rich
Some frugal habits are worth it, no matter what tax bracket you're in.
-
 The Best Precious Metals ETFs to Buy in 2026
Precious metals ETFs provide a hedge against monetary debasement and exposure to industrial-related tailwinds from emerging markets.
-
 For the 2% Club, the Guardrails Approach and the 4% Rule Do Not Work: Here's What Works Instead
For retirees with a pension, traditional withdrawal rules could be too restrictive. You need a tailored income plan that is much more flexible and realistic.
-
 Retiring Next Year? Now Is the Time to Start Designing What Your Retirement Will Look Like
This is when you should be shifting your focus from growing your portfolio to designing an income and tax strategy that aligns your resources with your purpose.
-
 I'm a Financial Planner: This Layered Approach for Your Retirement Money Can Help Lower Your Stress
To be confident about retirement, consider building a safety net by dividing assets into distinct layers and establishing a regular review process. Here's how.
-
 Stocks Sink With Alphabet, Bitcoin: Stock Market Today
A dismal round of jobs data did little to lift sentiment on Thursday.
-
 The 4 Estate Planning Documents Every High-Net-Worth Family Needs (Not Just a Will)
The key to successful estate planning for HNW families isn't just drafting these four documents, but ensuring they're current and immediately accessible.
-
 Love and Legacy: What Couples Rarely Talk About (But Should)
Couples who talk openly about finances, including estate planning, are more likely to head into retirement joyfully. How can you get the conversation going?
-
 How to Get the Fair Value for Your Shares When You Are in the Minority Vote on a Sale of Substantially All Corporate Assets
When a sale of substantially all corporate assets is approved by majority vote, shareholders on the losing side of the vote should understand their rights.
