Are You Better Off Than You Were Four Years Ago?
It's the question every incumbent up for reelection has had to answer since challenger Ronald Reagan first posed it to incumbent President Jimmy Carter in 1980.

Profit and prosper with the best of Kiplinger's advice on investing, taxes, retirement, personal finance and much more. Delivered daily. Enter your email in the box and click Sign Me Up.
You are now subscribed
Your newsletter sign-up was successful
Want to add more newsletters?

Delivered daily
Kiplinger Today
Profit and prosper with the best of Kiplinger's advice on investing, taxes, retirement, personal finance and much more delivered daily. Smart money moves start here.

Sent five days a week
Kiplinger A Step Ahead
Get practical help to make better financial decisions in your everyday life, from spending to savings on top deals.

Delivered daily
Kiplinger Closing Bell
Get today's biggest financial and investing headlines delivered to your inbox every day the U.S. stock market is open.

Sent twice a week
Kiplinger Adviser Intel
Financial pros across the country share best practices and fresh tactics to preserve and grow your wealth.

Delivered weekly
Kiplinger Tax Tips
Trim your federal and state tax bills with practical tax-planning and tax-cutting strategies.

Sent twice a week
Kiplinger Retirement Tips
Your twice-a-week guide to planning and enjoying a financially secure and richly rewarding retirement

Sent bimonthly.
Kiplinger Adviser Angle
Insights for advisers, wealth managers and other financial professionals.

Sent twice a week
Kiplinger Investing Weekly
Your twice-a-week roundup of promising stocks, funds, companies and industries you should consider, ones you should avoid, and why.

Sent weekly for six weeks
Kiplinger Invest for Retirement
Your step-by-step six-part series on how to invest for retirement, from devising a successful strategy to exactly which investments to choose.
It's the question every incumbent up for reelection has had to answer since challenger Ronald Reagan first posed it to incumbent President Jimmy Carter in 1980. Was the president's first-term performance, as measured by your quality of life, worthy of an encore? In this 2012 campaign, the answer is not so simple -- despite all the campaign rhetoric on both sides.
Mitt Romney blasts President Obama for presiding over a period of falling incomes, rising gas and food prices, persistently high unemployment and growing national debt. His slogan: "We can't afford four more years." Obama cites improving job-creation numbers, steps toward more-equal pay for men and women, more consumer protection against predatory lending practices, and more Americans covered by health insurance than ever before. His campaign says, "We've come too far to turn back now."
So, are you better off? Are we better off? Consider the following measures of individual and national economic growth throughout the last four years to help you answer this critical question.
Unemployment Rate
- August 2008: 6.1%
- January 2009 (when Obama takes office): 7.8%
- August 2012: 8.1%
If you're unemployed, you're obviously not better off financially. Even if you've held onto your job, the persistently high unemployment rate may have worsened your work life. For example, you may have a bigger workload now, picking up the slack of a smaller staff. Or you may have feared asking for more pay, feeling lucky to just have a job.
It seems like only yesterday that economists considered a jobless rate of 5% to be normal for the U.S. economy. Then came the financial meltdown and the Great Recession, causing a steep climb to an October 2009 peak of 10.0%. Since then, the unemployment rate has slowly dropped, but it remains painfully high by the old normal standard.
Looking at payroll numbers, the past four years seem less bleak. In August 2008, the U.S. economy lost 274,000 jobs. In January 2009, 818,000 jobs were lost. But the economy has been slowly adding jobs for the past 23 months, posting an additional 96,000 jobs in August.
UPDATE: On October 5, the Bureau of Labor Statistics reported that, in September, the unemployment rate fell to 7.8% and 114,000 jobs were added to the economy. Also, the number of jobs added in August was updated from 96,000 (as reported above) to 142,000.
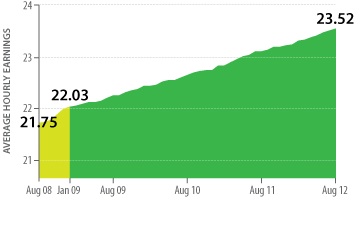
Average Hourly Earnings
- August 2008: $21.75
- January 2009: $22.03
- August 2012: $23.52
For those on the job, the numbers are heading in the right direction. And if your own pay raises have beaten inflation (now at just 1.69%), you might consider yourself better off. While average hourly earnings went up by 8.1% between 2008 and 2012, the consumer price index went up just 5.0%.
But, overall, the slow rise in average hourly wages throughout the past four years does not quite track with the grim picture of median household income. In 2011, median household income was $50,054, according to the Census Bureau's most recent annual report -- or 3.8% less than the 2008 median income of $52,029.
Lower-income households have been hit the hardest. From 2010 to 2011, the wealthiest 5% of households have seen their incomes rise 5.1%, while those in the middle have suffered a 1.7% drop. The top 5% have seen their incomes restored to pre-Great Recession levels; for those in the middle fifth, income remained down 8%. "High unemployment hurts low- and moderate-income people more," says economist Heidi Shierholz of the Economic Policy Institute. "So only just this elite group has recovered."
UPDATE: On October 5, the Bureau of Labor Statistics reported that average hourly earnings in September rose to $23.58. It also adjusted the average in August from $23.52 (as reported about), dropping it by a penny.
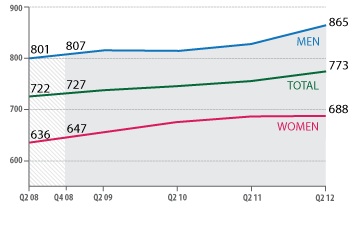
Men vs. Women: Weekly Earnings
- 2008 Q2:
$801 for men
$636 for women
- 2009 Q1:
$815 for men
$645 for women
- 2012 Q2:
$865 for men
$688 for women
The first bill that Obama signed into law was the Lilly Ledbetter Fair Pay Act, which extended the statute of limitations on filing discrimination cases. But it seems to have had little effect on the income gap between genders so far: While earnings are on the rise for both sexes, women have continued to earn only about 80% as much as men, on average, throughout the past four years.
Some chalk up the pay difference to women's career and family choices. For instance, women with children are more likely to take time off than men.
But even in female-dominated professions, men are paid more than women, on average. And younger women, who are less likely to have had their incomes affected by having children, still earn less than their male counterparts. In 2011, young female college graduates received hourly wages 13.9% lower than male grads, on average.

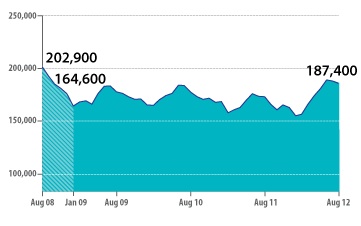
Median Home Prices
- August 2008: $202,900
- January 2009: $164,600
- August 2012: $187,400
The housing collapse was one of the biggest calamities of the Great Recession. Home prices had been rising steadily for decades, reaching bubble territory in 2001. In July 2006, the monthly median sales price of existing homes peaked at $230,400, according to the National Association of Realtors, before falling 21%, to $181,300, in three years. Homeowners lost an estimated $7 trillion in equity when the bubble burst. Foreclosures peaked in 2010 with 2.9 million filings, according to RealtyTrac, an online marketplace of foreclosure properties.
The national housing market has stabilized and is just now starting its recovery. Median prices seem to have bottomed, hitting a low of $156,100 in February 2011. Existing home sales continued to improve in August 2012, according to NAR, rising 9.3% over the past year. Foreclosure filings were down, dropping 15% over the past year. And according to mortgage data firm CoreLogic, the number of homeowners who were "underwater" on their mortgages is down 6% this year, to 10.8 million.
Mortgage rates remain at record lows: The average rate for a 30-year fixed mortgage was 3.83% in September 2012, compared with 5.78% in January 2009, when Obama took office, and 6.64% in September 2008. If you were able to take advantage of such low rates by refinancing or buying your first home, congratulations -- the past four years have been kind to your housing situation.
Dow Jones Industrial Average
- September 27, 2008: 11,143.13
- January 20, 2009: 7949.09
- September 27, 2012: 13,485.97
Investors who braved the market volatility of the past four years are winning with stocks today. Four years ago, Lehman Brothers had just declared bankruptcy, and the stock market, already in bear territory, went into free fall. In the 2007-09 bear market, the Dow and Standard & Poor's 500-stock index each plummeted about 55%.
Today, a bull market keeps charging upward. Since the market hit bottom on March 9, 2009, the Dow and the S&P 500 have risen by 106.4% and 113.5% through October 1, respectively, powered mostly by solid corporate earnings.
Those gains might seem surprising -- the rally has been markedly volatile. The markets have stumbled over fears of the Euro-debt crisis, a credit-rating downgrade and the economy falling back into another recession. But according to Wells Capital Management, this market recovery has been the "best ever post-war stock market rally." Jim Paulsen, perma-bull and the firm's chief investment strategist, wrote in his newsletter, Economic and Market Perspective, "The greatest gift bequeathed to investors in this recovery cycle has been a monumental wall of worry, which the stock [market] has endlessly climbed."
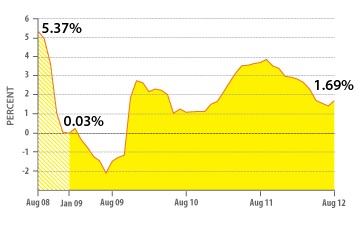
Inflation
- August 2008: 5.37%
- January 2009: 0.03%
- August 2012: 1.69%
Inflation concerns are reserved for the future. The past four years have overcome early 2009 worries of deflation and have otherwise seen moderate inflation rates. But the growing national debt and persistently super-low interest rates could portend a big inflation problem around the corner.
In the near-term, however, inflation should remain moderate. Kiplinger estimates that consumer prices will creep up at a 2% annual pace in the last quarter of 2012.
Prices on some items have risen faster than others, and consumers are shelling out more for groceries today than they did four years ago. According to the Bureau of Labor Statistics, the cost of food and beverages has risen by 8.1% since August 2008. Your bill will vary, of course, depending on what you put in your basket. For example, a pound of ground chuck cost $3.45, on average, in August, 49 cents more than in 2008. But the price of a gallon of whole milk dropped 41 cents to $3.47, on average.
Gas prices are higher today, too, and have been volatile over the past four years. On average, a gallon of regular gas cost $3.78 in late September, according to AAA. Four years ago, it was $3.67 a gallon, and, on Obama's Inauguration Day, it was a miniscule $1.84 a gallon.

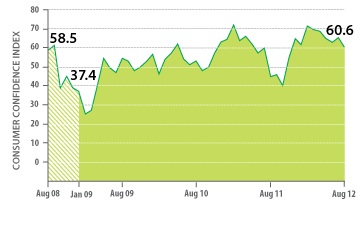
Consumer Confidence
- August 2008: 58.5
- January 2009: 37.4
- August 2012: 60.6
Four years ago, the Conference Board's Consumer Confidence Index was sinking to new levels. While recessions have historically been marked by index levels in the 50s or 60s, in February 2009 the index hit a record low of 25.3. The deep plunge was due to a shift in how much people expected to earn in the future. For the first time ever, says Lynn Franco, director of economic indicators at the Conference Board, "after the Lehman collapse and the onset of the financial crisis, we saw the pessimists outnumbering the optimists" with regard to income expectations.
Today, the index has bounced back up to 70.3 -- still far below 90, the mark for a healthy economy, but much improved over the past four years. The September survey showed that consumers were more positive about the current job market and "considerably more optimistic about the short-term outlook for business conditions, employment and their financial situation," said Franco in a statement.

Credit Card Debt
- 2008 Q2: $850 billion
- 2009 Q1: $843 billion
- 2012 Q2: $672 billion
Did the Great Recession scare you into sticking your credit card in the freezer? You're probably better off without it. And you're not alone: Americans have cut back on their debt over the past four years. According to the Federal Reserve Bank of New York, outstanding household debt fell by nearly $1.3 trillion from its peak in the third quarter of 2008 through the second quarter of 2012.
This trend can be attributed in part to some debts being written off due to defaults. But "much of the debt reduction seen at the overall level was attributable to … households actively borrowing less and paying down existing liabilities," according to the New York Fed.
The CARD Act of 2009 also had an impact on credit card debts -- good and bad. On the pro-consumer side, the Consumer Financial Protection Bureau notes that sudden rate hikes on cards are far less frequent, cardholders are paying much less in late fees and over-limit fees, and "consumers report that their credit card costs are clearer." On the other hand, because of the new legislation, some card issuers raised interest rates and increased balance-transfer fees.
Student-loan debts also continue to weigh heavily on households. The average student loan balance in 2012 stood at $24,301, up from $20,820 in 2009, when Obama took office, and $19,885 in 2008. Student-loan delinquency rates have also increased this year.
Personal Savings Rate
- 2008 Q2: 6.16%
- 2009 Q1: 5.50%
- 2012 Q2: 3.98%
The personal savings rate had been on a long, slow decline for decades, dropping from a record high of 10.9% in 1982 to a record low of 1.5% in 2005. Once the Great Recession struck, savings spiked, only to come back down slightly over the past four years as consumers gained confidence and began to spend again.
In his book, The Decline in Saving, Brookings Institute economist Barry P. Bosworth points to evidence that an increasing number of households may not be saving enough for retirement. "Particularly in the aftermath of the financial crisis, the economic well-being of the baby boom generation may be less favorable than suggested in [older] retirement research," he wrote.
And retirement confidence has, in fact, declined over the past four years, according to the Employee Benefit Research Institute. In the 2012 Retirement Confidence survey, only 52% of respondents reported being very or somewhat confident that they'd have enough money to live comfortably throughout their retirement years, compared with 61% in 2008 and 54% in 2009, when Obama took office.

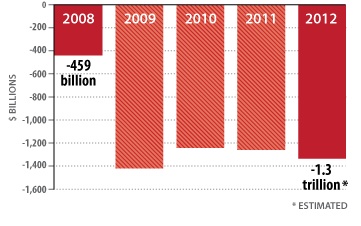
Federal Deficit
- 2008: $458.6 billion
- 2009: $1.4 trillion
- 2012: $1.3 trillion
An increasing federal deficit carries with it the threat of big pocketbook problems for future generations of American adults. If it goes unchecked, it could mean higher interest rates and taxes, fewer benefits and a weaker U.S. dollar.
In the past five decades, the only back-to-back years in which our country has seen a budget surplus were 1998 through 2001. Since then, we've slipped into the red, taking a deep dive in 2009, when the deficit was at 10.1% of gross domestic product -- the highest since World War II.

Profit and prosper with the best of Kiplinger's advice on investing, taxes, retirement, personal finance and much more. Delivered daily. Enter your email in the box and click Sign Me Up.

Rapacon joined Kiplinger in October 2007 as a reporter with Kiplinger's Personal Finance magazine and became an online editor for Kiplinger.com in June 2010. She previously served as editor of the "Starting Out" column, focusing on personal finance advice for people in their twenties and thirties.
Before joining Kiplinger, Rapacon worked as a senior research associate at b2b publishing house Judy Diamond Associates. She holds a B.A. degree in English from the George Washington University.
-
 5 Vince Lombardi Quotes Retirees Should Live By
The iconic football coach's philosophy can help retirees win at the game of life.
-
 The $200,000 Olympic 'Pension' is a Retirement Game-Changer for Team USA
The donation by financier Ross Stevens is meant to be a "retirement program" for Team USA Olympic and Paralympic athletes.
-
 10 Cheapest Places to Live in Colorado
Property Tax Looking for a cozy cabin near the slopes? These Colorado counties combine reasonable house prices with the state's lowest property tax bills.
-
 32 Ways to Make Money in 2025
business Check out these cool side hustles to earn bonus bucks this year.
-
 12 IRS Audit Red Flags for the Self-Employed
taxes If you are self-employed, minimize the odds of an IRS audit by avoiding these audit triggers.
-
 Business Cost Outlooks for 2022: Eight Key Sectors
Economic Forecasts What’s in store for all sorts of business costs in 2022?
-
 PPP Loan Basics for Small Business Owners
Coronavirus and Your Money Although uncertainty and confusion have surrounded the Paycheck Protection Program since its launch, that shouldn't stop small business owners from participating in the loan program, which was just extended to May 31.
-
 "Above-the-Line" Deductions for Your 2021 Tax Return
Tax Breaks If, like most people, you claim the standard deduction instead of itemized deductions on your return, there are still many other tax deductions available that could save you a lot of money.
-
 The Biden Tax Plan: How the Build Back Better Act Could Affect Your Tax Bill
Politics Depending on your income, the Build Back Better Act recently passed by the House could boost or cut your future tax bills.
-
 9 Tips for Better Time Management in Retirement
retirement These important time management techniques will help destress your life as you get busier -- yes, busier -- in your golden years.
-
 7 Ways PPP Loans Just Got Better
small business loans The Paycheck Protection Program Flexibility Act makes a number of changes to the popular small-business loan program. See how your business might benefit from the improvements.
