10 Worst Stocks of the Bull Market
Pity investors who have held commodity stocks all the way through this long bull market.


Profit and prosper with the best of Kiplinger's advice on investing, taxes, retirement, personal finance and much more. Delivered daily. Enter your email in the box and click Sign Me Up.
You are now subscribed
Your newsletter sign-up was successful
Want to add more newsletters?

Delivered daily
Kiplinger Today
Profit and prosper with the best of Kiplinger's advice on investing, taxes, retirement, personal finance and much more delivered daily. Smart money moves start here.

Sent five days a week
Kiplinger A Step Ahead
Get practical help to make better financial decisions in your everyday life, from spending to savings on top deals.

Delivered daily
Kiplinger Closing Bell
Get today's biggest financial and investing headlines delivered to your inbox every day the U.S. stock market is open.

Sent twice a week
Kiplinger Adviser Intel
Financial pros across the country share best practices and fresh tactics to preserve and grow your wealth.

Delivered weekly
Kiplinger Tax Tips
Trim your federal and state tax bills with practical tax-planning and tax-cutting strategies.

Sent twice a week
Kiplinger Retirement Tips
Your twice-a-week guide to planning and enjoying a financially secure and richly rewarding retirement

Sent bimonthly.
Kiplinger Adviser Angle
Insights for advisers, wealth managers and other financial professionals.

Sent twice a week
Kiplinger Investing Weekly
Your twice-a-week roundup of promising stocks, funds, companies and industries you should consider, ones you should avoid, and why.

Sent weekly for six weeks
Kiplinger Invest for Retirement
Your step-by-step six-part series on how to invest for retirement, from devising a successful strategy to exactly which investments to choose.
Pity investors who have held commodity stocks all the way through this long bull market. Although the major stock indexes have more than tripled since the last bear market bottomed, on March 9, 2009, stocks tied to oil, gas, precious metals and other commodities have sunk over the past 7½ years-plus, leaving shareholders with sometimes striking losses.
Of course, yesterday’s losers can sometimes prove to be the hot stocks of tomorrow. That may be especially true for energy stocks, particularly now that the OPEC oil cartel seems intent on cutting production, which could help boost crude prices. With that in mind, we took a closer look at the 10 stocks that performed the worst from the start of the bull market until mid September. We found a few diamonds in the rough, plenty of value traps and a few that could go either way.
Stocks were selected from the components of the Standard & Poor's 500 index by Morningstar and are listed in order of worst performance from March 9, 2009, through September 19, 2016. Prices, returns and related data are as of October 11. Price-earnings ratios are based on estimated year-ahead earnings. Returns are cumulative.

Transocean Ltd.
- Symbol: RIG
- Share price: $10.23
- Market capitalization: $3.7 billion
- Bull-market return: -77.3%
- Price-earnings ratio: 47
- Dividend yield: none
- The business: Transocean provides contract offshore-drilling services for oil and gas producers.
- What drove the stock: Transocean shares plunged following the explosion of its Deepwater Horizon rig, which resulted in the largest oil spill in U.S. history. The shares got a short-lived bounce in 2011, before the reality of the disaster’s cost hit Transocean’s bottom line, sending up a gusher of red ink. Things began to look more hopeful in 2013, when oil briefly rose above $100 a barrel. But crude prices subsequently hit the skids and, although they’ve recovered a bit, remain at roughly 50% below their 2013 peaks. The companies that rely on high-cost production methods, such as offshore drilling, were hit the hardest and, thus, were more likely to postpone or cancel projects. Transocean was forced to discontinue its dividend in 2015.
- Outlook: Sell. The offshore-drilling business is likely to face oversupply for some time, thanks to still-low crude prices and a glut of new rigs. If oil prices roar back, Transocean might, too. But with West Texas Crude still selling for less than $50 a barrel, the risks are too great.

First Solar
- Symbol: FSLR
- Share price: $38.28
- Market capitalization: $3.9 billion
- Bull-market return: -68.2%
- Price-earnings ratio: 14
- Dividend yield: none
- The business: First Solar makes and markets solar panels.
- What drove the stock: Tax credits for installing solar panels sent First Solar stock soaring in 2007, its first full year as a publicly traded company. But increased competition from both U.S. and Chinese solar manufacturers started to pinch sales growth at the beginning of the decade, and falling prices left First Solar with big losses in 2011 and 2012. The company has been profitable since then, but investors remain wary of solar companies, partly because a key player, SunEdison (SUNEQ), filed for bankruptcy protection earlier this year.
- Outlook: Buy. Competition, particularly from low-cost manufacturers in China, remains a risk, but First Solar’s balance sheet is rock-solid and demand for solar energy should remain robust, giving the stock above-average appreciation potential in the long run.

Diamond Offshore Drilling
- Symbol: DO
- Share price: $17.49
- Market capitalization: $2.4 billion
- Bull-market return: -59.5%
- Price-earnings ratio: 24
- Dividend yield: none
- The business: Offshore drilling for oil and gas.
- What drove the stock: Unlike Transocean, Diamond Offshore wasn’t at the center of an environmental disaster. It has simply been a victim of falling oil prices, which have tamped demand for Diamond’s rigs. Sales and profits have been sliding since 2009, and Diamond recently discontinued its dividend to conserve cash.
Outlook: Sell. Oil prices have to rise sharply for high-cost offshore drilling to come back, and OPEC is unlikely to cut production enough for that to happen. As with interest rates, oil prices are likely to stay “lower for longer.”

Southwestern Energy
- Symbol: SWN
- Share price: $13.17
- Market capitalization: $6.3 billion
- Bull-market return: -51.0%
- Price-earnings ratio: 24
- Dividend yield: none
- The business: Southwestern explores for and produces natural gas.
- What drove the stock: The Fayetteville and Marcellus Shale formations, among the richest natural gas finds ever, were Southwestern Energy’s claim to fame when gas prices were high. It was also its undoing as gas prices plunged from $4.24 per million British thermal units at the end of 2013 to a low of $1.56 in March. Suffering with a $4.6 billion loss in 2015, the company sold new shares in July to pay off debt. That may have diluted the interests of existing shareholders, but the new capital helps the balance sheet.
- Outlook: Hold. Gas prices are firming and Southwestern is becoming more efficient. Though another dip in gas prices remains a risk, Value Line analyst Michael Napoli says the stock has healthy recovery potential.

Chesapeake Energy
- Symbol: CHK
- Share price: $6.28
- Market capitalization: $5.0 billion
- Bull-market return: -43.4%
- Price-earnings ratio: 15
- Dividend yield: none
- The business: Chesapeake explores for and produces oil and gas, both on and offshore
- What drove the stock: The collapse of oil and gas prices savaged both the balance sheet and the shares of Chesapeake Energy, which was well known under its former CEO, the late Aubrey McClendon, for paying top dollar for land and mineral rights. Under current CEO Doug Lawler, the company is cutting costs and selling assets to stem a tide of red ink, but the long-term leases it signed during McClendon’s tenure will take years to roll off the balance sheet.
- Outlook: Sell. Chesapeake’s stock has nearly quadrupled since February, as the company quelled rumors of impending bankruptcy. But the rebound does not warrant taking a chance on this still-troubled company.
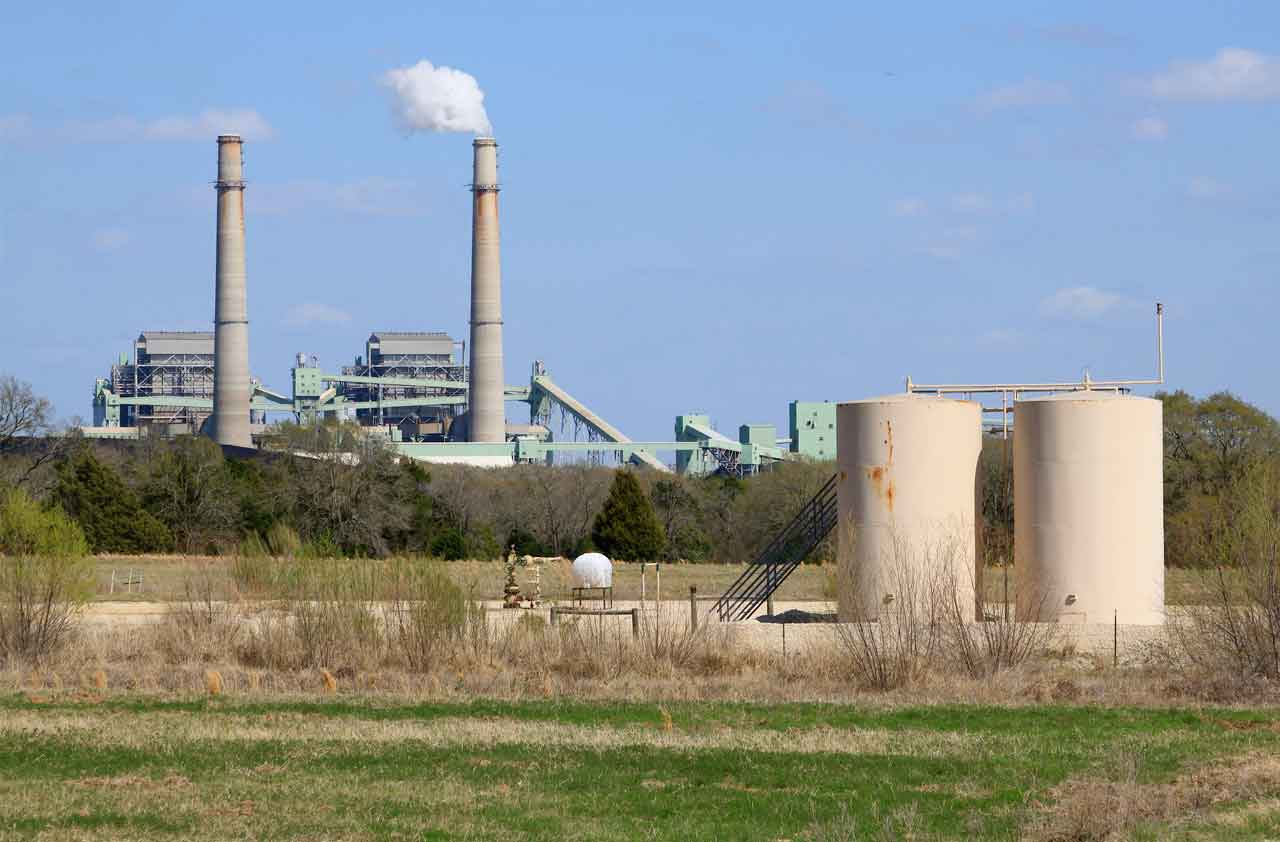
NRG Energy
- Symbol: NRG
- Share price: $11.13
- Market capitalization: $3.5 billion
- Bull-market return: -29.4%
- Price-earnings ratio: 27
- Dividend yield: 1.1%
- The business: NRG is the largest publicly traded independent wholesale producer in the U.S., generating electricity from oil, gas, solar, coal and nuclear power.
- What drove the stock: Big declines in in commodity prices, coupled with weak demand for electricity and overcapacity, forced NRG to sell and write down assets, particularly for its coal plants. As a result, NRG posted a $6.4 billion loss in 2015 and reported another, though smaller, loss in the second quarter of 2016. The company initiated a dividend in 2012, but early this year it slashed the payout from an annual rate of 58 cents per share to 12 cents.
- Outlook: Buy. NRG is taking advantage of SunEdison’s asset sales to buy solar and wind properties cheaply, and Value Line analyst Jeremy Butler thinks that will prove to be a smart move once demand for energy picks up over the next few years. Butler thinks NRG’s stock has above-average profit potential, though investors will need to be patient.

The Mosaic Company
- Symbol: MOS
- Share price: $24.86Market capitalization: $8.7 billion
- Bull-market return: -27.6%
- Price-earnings ratio: 30
- Dividend yield: 4.5%
- The business: Mosaic produces phosphate and potash for fertilizers.
- What drove the stock: Slack demand for agricultural products has dogged Mosaic since the end of the Great Recession in 2009, depressing both sales and earnings. Value Line analyst Michael Napoli expects cost cutting and a slight pickup in demand to help reverse this slide in 2017. But, for the moment, the stock’s biggest selling point is its generous dividend yield.
- Outlook: Hold. Population growth will eventually drive up demand for fertilizer products. But fierce competition and the vagaries of agriculture leave Mosaic vulnerable to pricing pressure. That said, the stock has potential for patient investors with long time horizons.
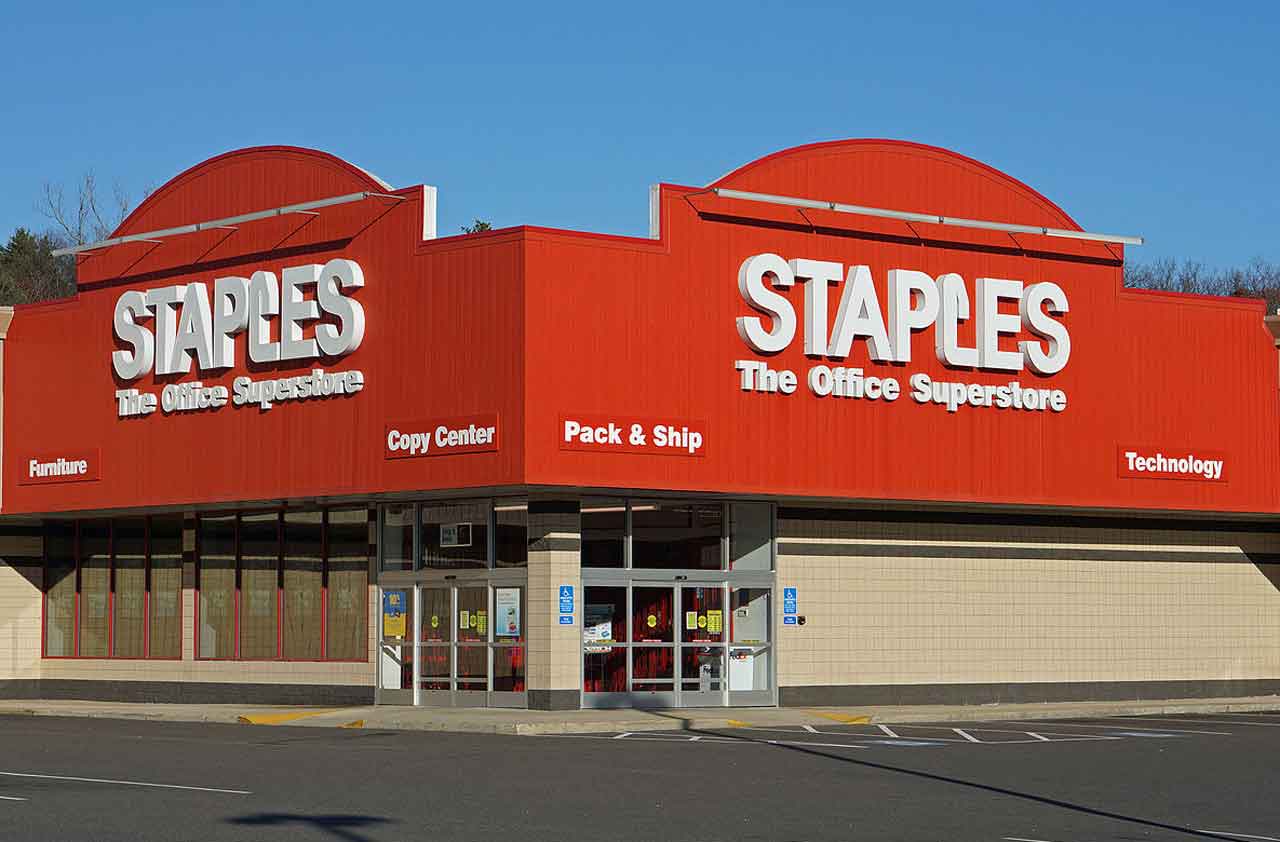
Staples
- Symbol: SPLS
- Share price: $7.76
- Market capitalization: $5.0 billion
- Bull-market return: -26.9%
- Price-earnings ratio: 9
- Dividend yield: 6.2%
- The business: Staples is the nation’s number one retailer of office supplies.
- What drove the stock: Heated competition in the office-supply market has kept profits paper thin. Staples planned to address that by buying competitor Office Depot (ODP), but regulators nixed the planned merger in May, triggering a plunge in Staples’ stock. Staples is now closing stores and exploring “strategic alternatives” for its European operations. Cost cutting is expected to slash annual expenses by $300 million.
- Outlook: Buy. Competition in the office-supply market is likely to keep profit margins low, and that may weigh on near-term results, says Value Line analyst Oriatal Haiby. But she thinks Staples has superior long-term potential. Meanwhile, you can collect generous dividends while you wait for the recovery.

Freeport McMoRan
- Symbol: FCX
- Share price: $9.87
- Market capitalization: $13.1 billion
- Bull-market return: -22.7%
- Price-earnings ratio: 8
- Dividend yield: none
- The business: Freeport explores for and produces oil and gas, as well as gold, copper and other minerals.
- What drove the stock: Once known as Freeport-McMoRan Copper & Gold, the company changed its name after buying Plains Exploration and McMoRan Exploration for $20 billion, including assumed debt, in 2013. The timing couldn’t have been worse. Oil prices started falling the following year, exacerbating the impact of falling gold and copper prices. Freeport has been bleeding red ink for three years. Now it is divesting itself of many of its oil assets to repair the damage.
- Outlook: Hold. Freeport has valuable mining assets, and its oil and gas divestitures should keep the company afloat. But swings in commodity prices pose significant risks.
Hess Corp.
- Symbol: HES
- Share price: $52.57
- Market capitalization: $16.6 billion
- Bull-market return: -7.7%
- Price-earnings ratio: Not available (loss expected)
- Dividend yield: 1.9%
- The business: Hess engages in oil and gas exploration and production.
- What drove the stock: Plunging oil and gas prices aren’t the only problem at Hess, says Morningstar analyst Stephen Simko. Even before oil prices started sliding, Hess was going way over budget in its quest to find and develop new oil and gas resources in foreign markets such as Denmark, Guyana, Malaysia, and Norway, as well as in the Gulf of Mexico and the Bakken shale fields of North Dakota. But the costly explorations consistently yielded less than anticipated and spurred a shareholder revolt in 2013 that led to the ousting of nine members of the board and to sales of several assets.
- Outlook: Sell. A recovery in oil prices could help this laggard, as could a further shake-up in its management ranks. But the stock has jumped some 13% this year as oil prices have firmed. For now, opportunities in the energy sector look better elsewhere.
Profit and prosper with the best of Kiplinger's advice on investing, taxes, retirement, personal finance and much more. Delivered daily. Enter your email in the box and click Sign Me Up.

-
 Dow Adds 1,206 Points to Top 50,000: Stock Market Today
The S&P 500 and Nasdaq also had strong finishes to a volatile week, with beaten-down tech stocks outperforming.
-
 Ask the Tax Editor: Federal Income Tax Deductions
Ask the Editor In this week's Ask the Editor Q&A, Joy Taylor answers questions on federal income tax deductions
-
 States With No-Fault Car Insurance Laws (and How No-Fault Car Insurance Works)
A breakdown of the confusing rules around no-fault car insurance in every state where it exists.
-
 The 24 Cheapest Places To Retire in the US
When you're trying to balance a fixed income with an enjoyable retirement, the cost of living is a crucial factor to consider. Is your city the best?
-
 How Inflation, Deflation and Other 'Flations' Impact Your Stock Portfolio
There are five different types of "flations" that not only impact the economy, but also your investment returns. Here's how to adjust your portfolio for each one.
-
 Why I Still Won't Buy Gold: Glassman
One reason I won't buy gold is because while stocks rise briskly over time – not every month or year, but certainly every decade – gold does not.
-
 Should You Use a 25x4 Portfolio Allocation?
The 25x4 portfolio is supposed to be the new 60/40. Should you bite?
-
 Retirement Income Funds to Keep Cash Flowing In Your Golden Years
Retirement income funds are designed to generate a reliable cash payout for retirees. Here are a few we like.
-
 10 2024 Stock Picks From An Investing Expert
These 2024 stock picks have the potential to beat the market over the next 12 months.
-
 Special Dividends Are On The Rise — Here's What to Know About Them
More companies are paying out special dividends this year. Here's what that means.
-
 How to Invest in AI
Investors wanting to know how to invest in AI should consider these companies that stand to benefit from the boom.
